Visualize Performance Like Never Before

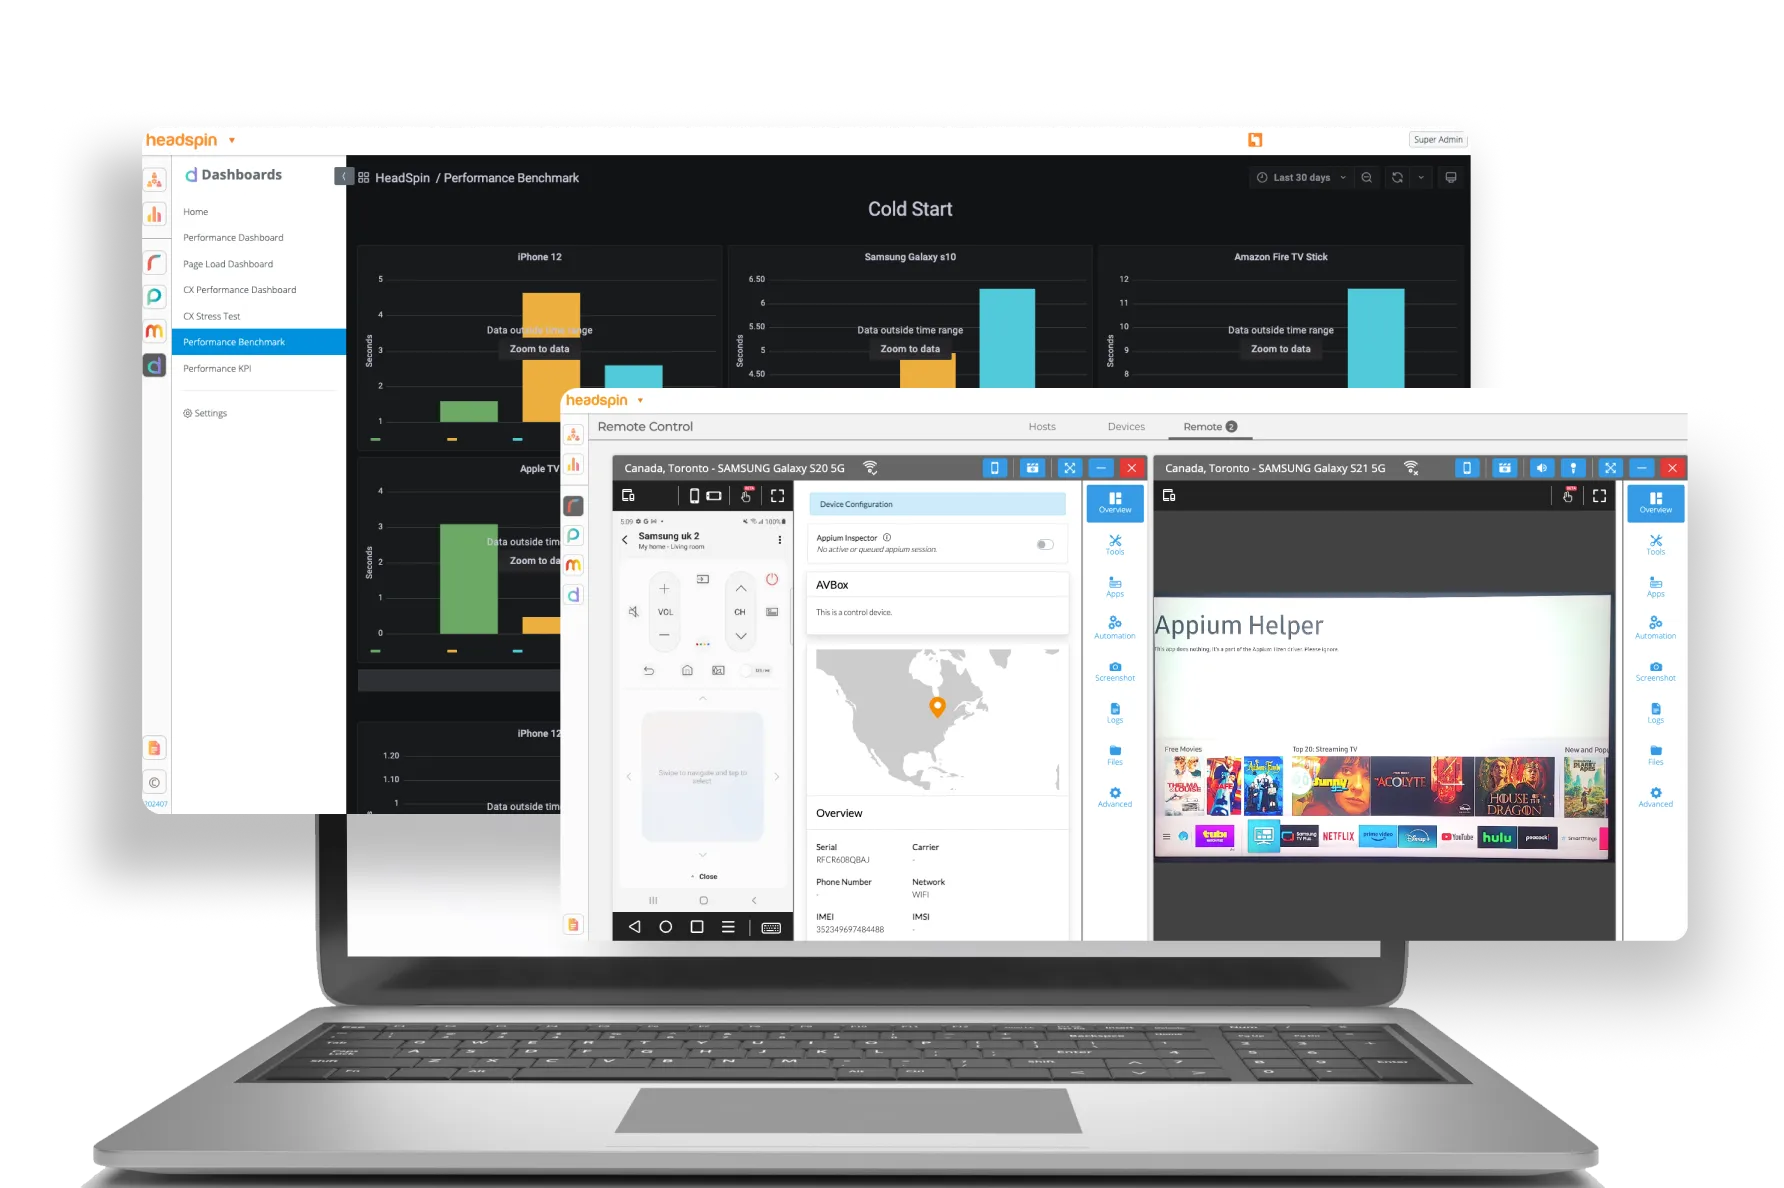
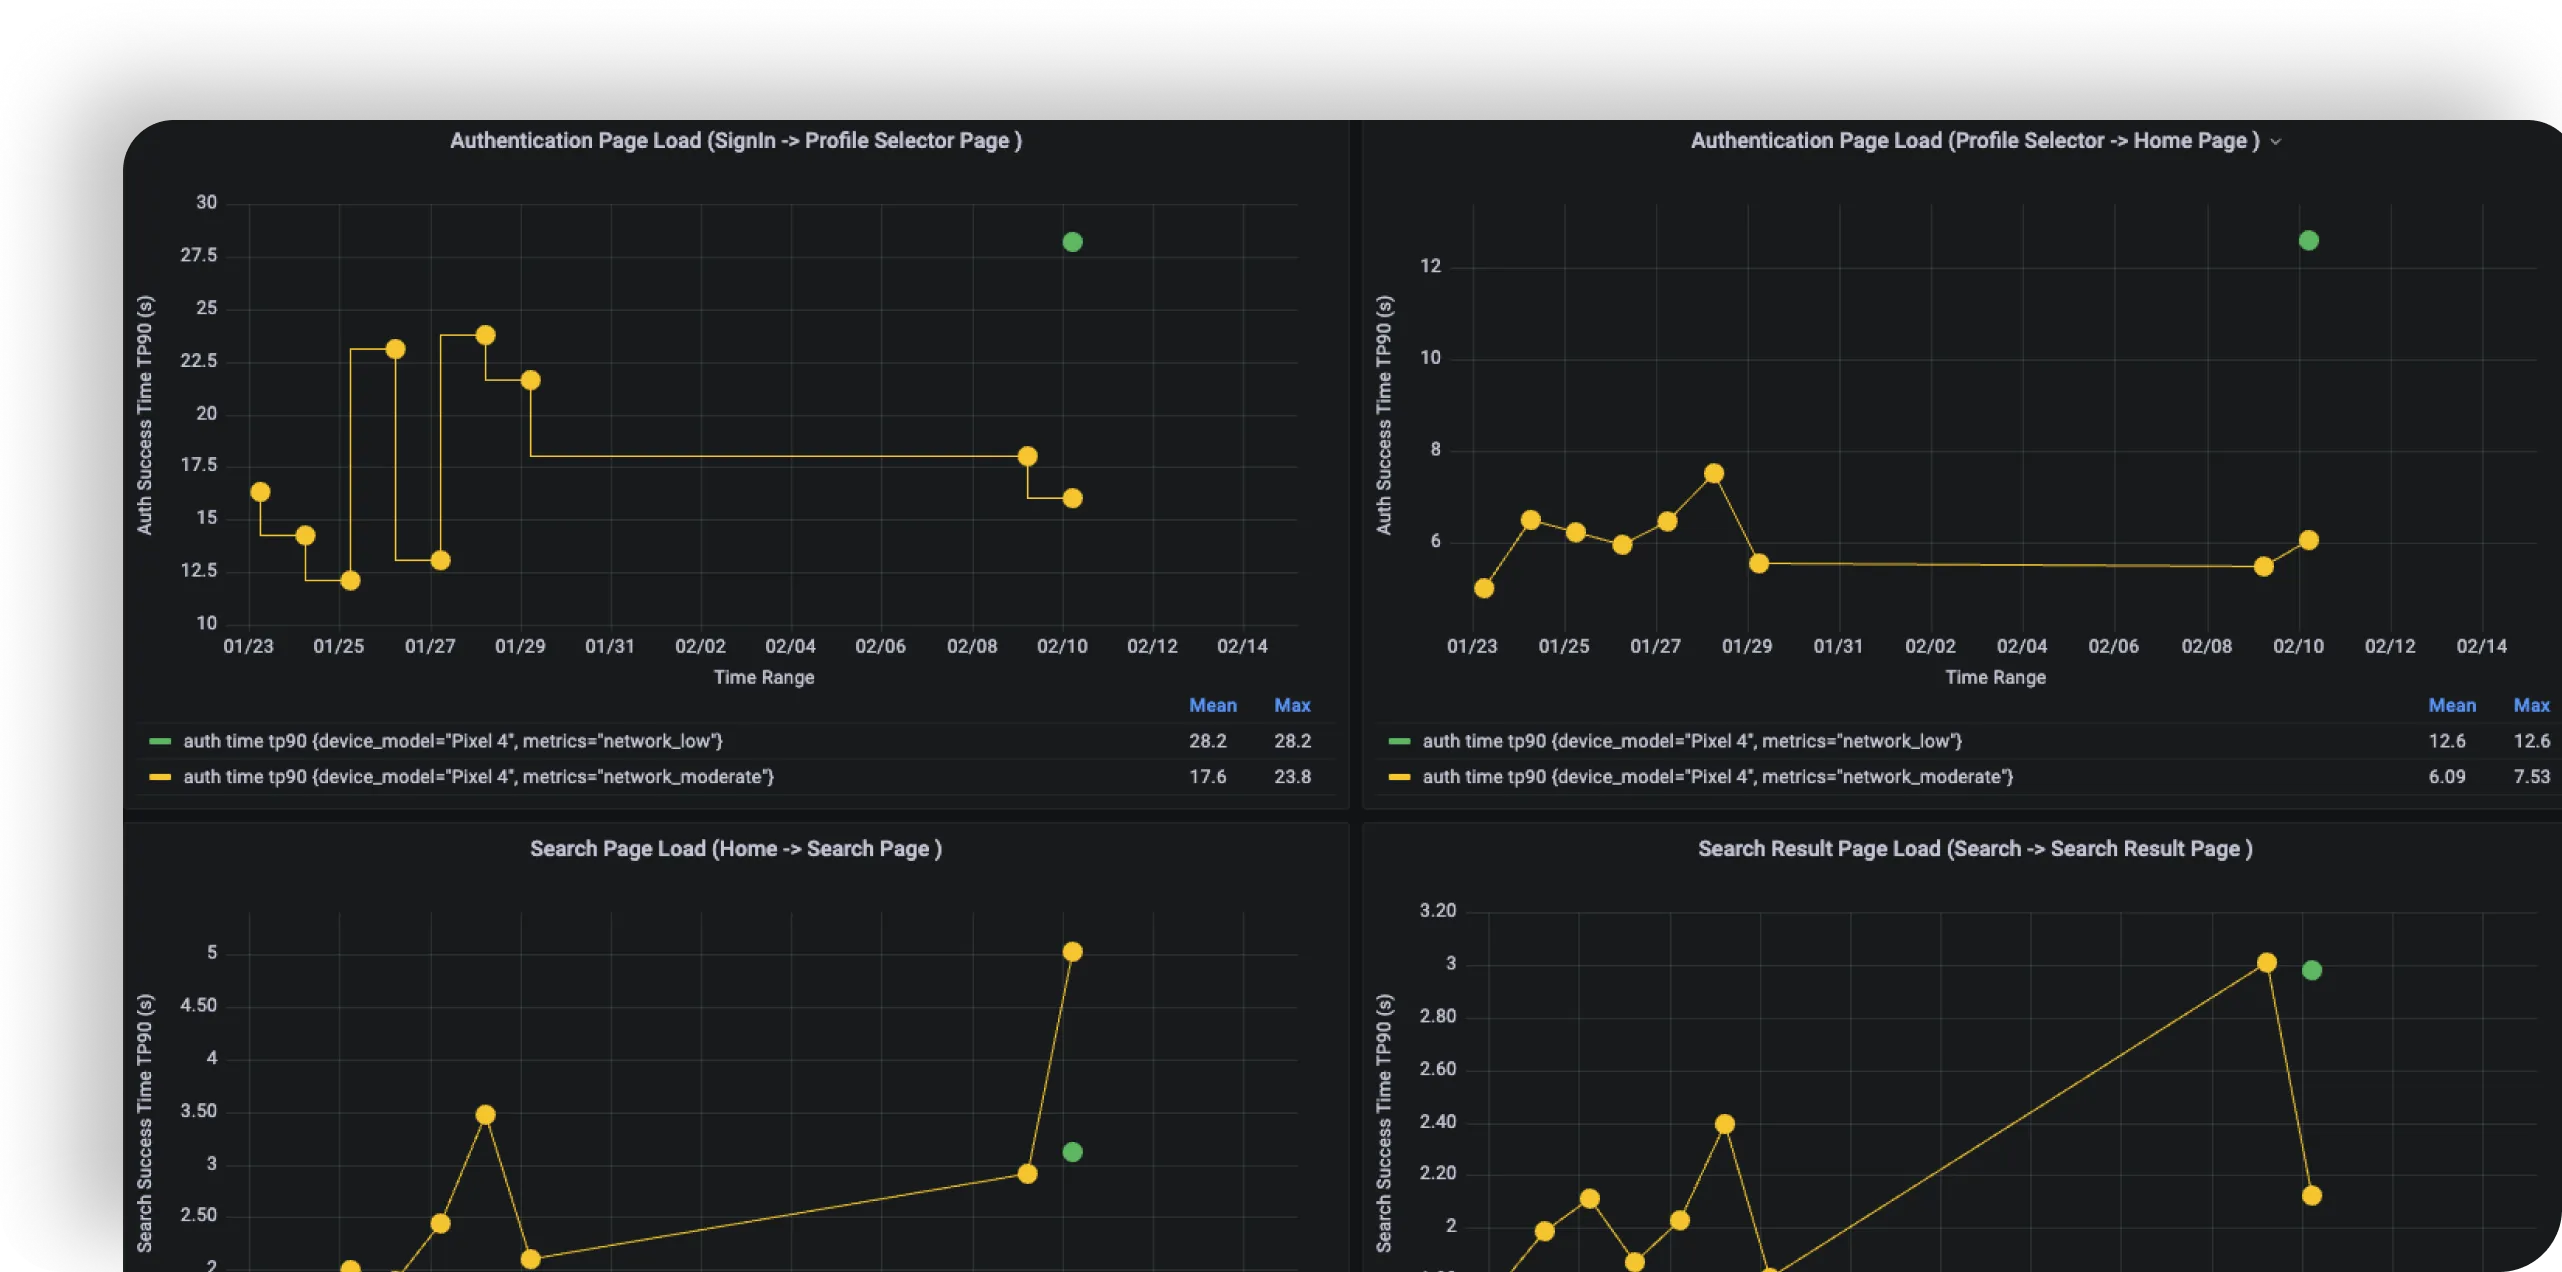
Performance metrics are only useful when they’re visible and actionable. That’s why HeadSpin now brings you a fully integrated Grafana dashboard experience, delivering real-time performance insights where and how you need them.
Built right into the HeadSpin platform, Grafana dashboards make it easy for teams to explore, monitor, and alert on app behavior across every build, device, and location.
Visualize Performance Like Never Before

Why It Matters

why it matters icon 1
Instantly visualize hundreds of sessions without manually opening each one
why it matters icon 2
Compare performance across builds, devices, and locations in one unified view
why it matters icon 3
Compare multiple test sessions in a single view for a full performance picture.
why it matters icon 4
Act faster with custom alerts and live dashboards tied to your test sessions.

Auto-Updating Dashboards

No need to rebuild charts with every test run. Dashboards update continuously as new builds are tested.
Auto-Updating Dashboards

App, Device, and Network KPIs

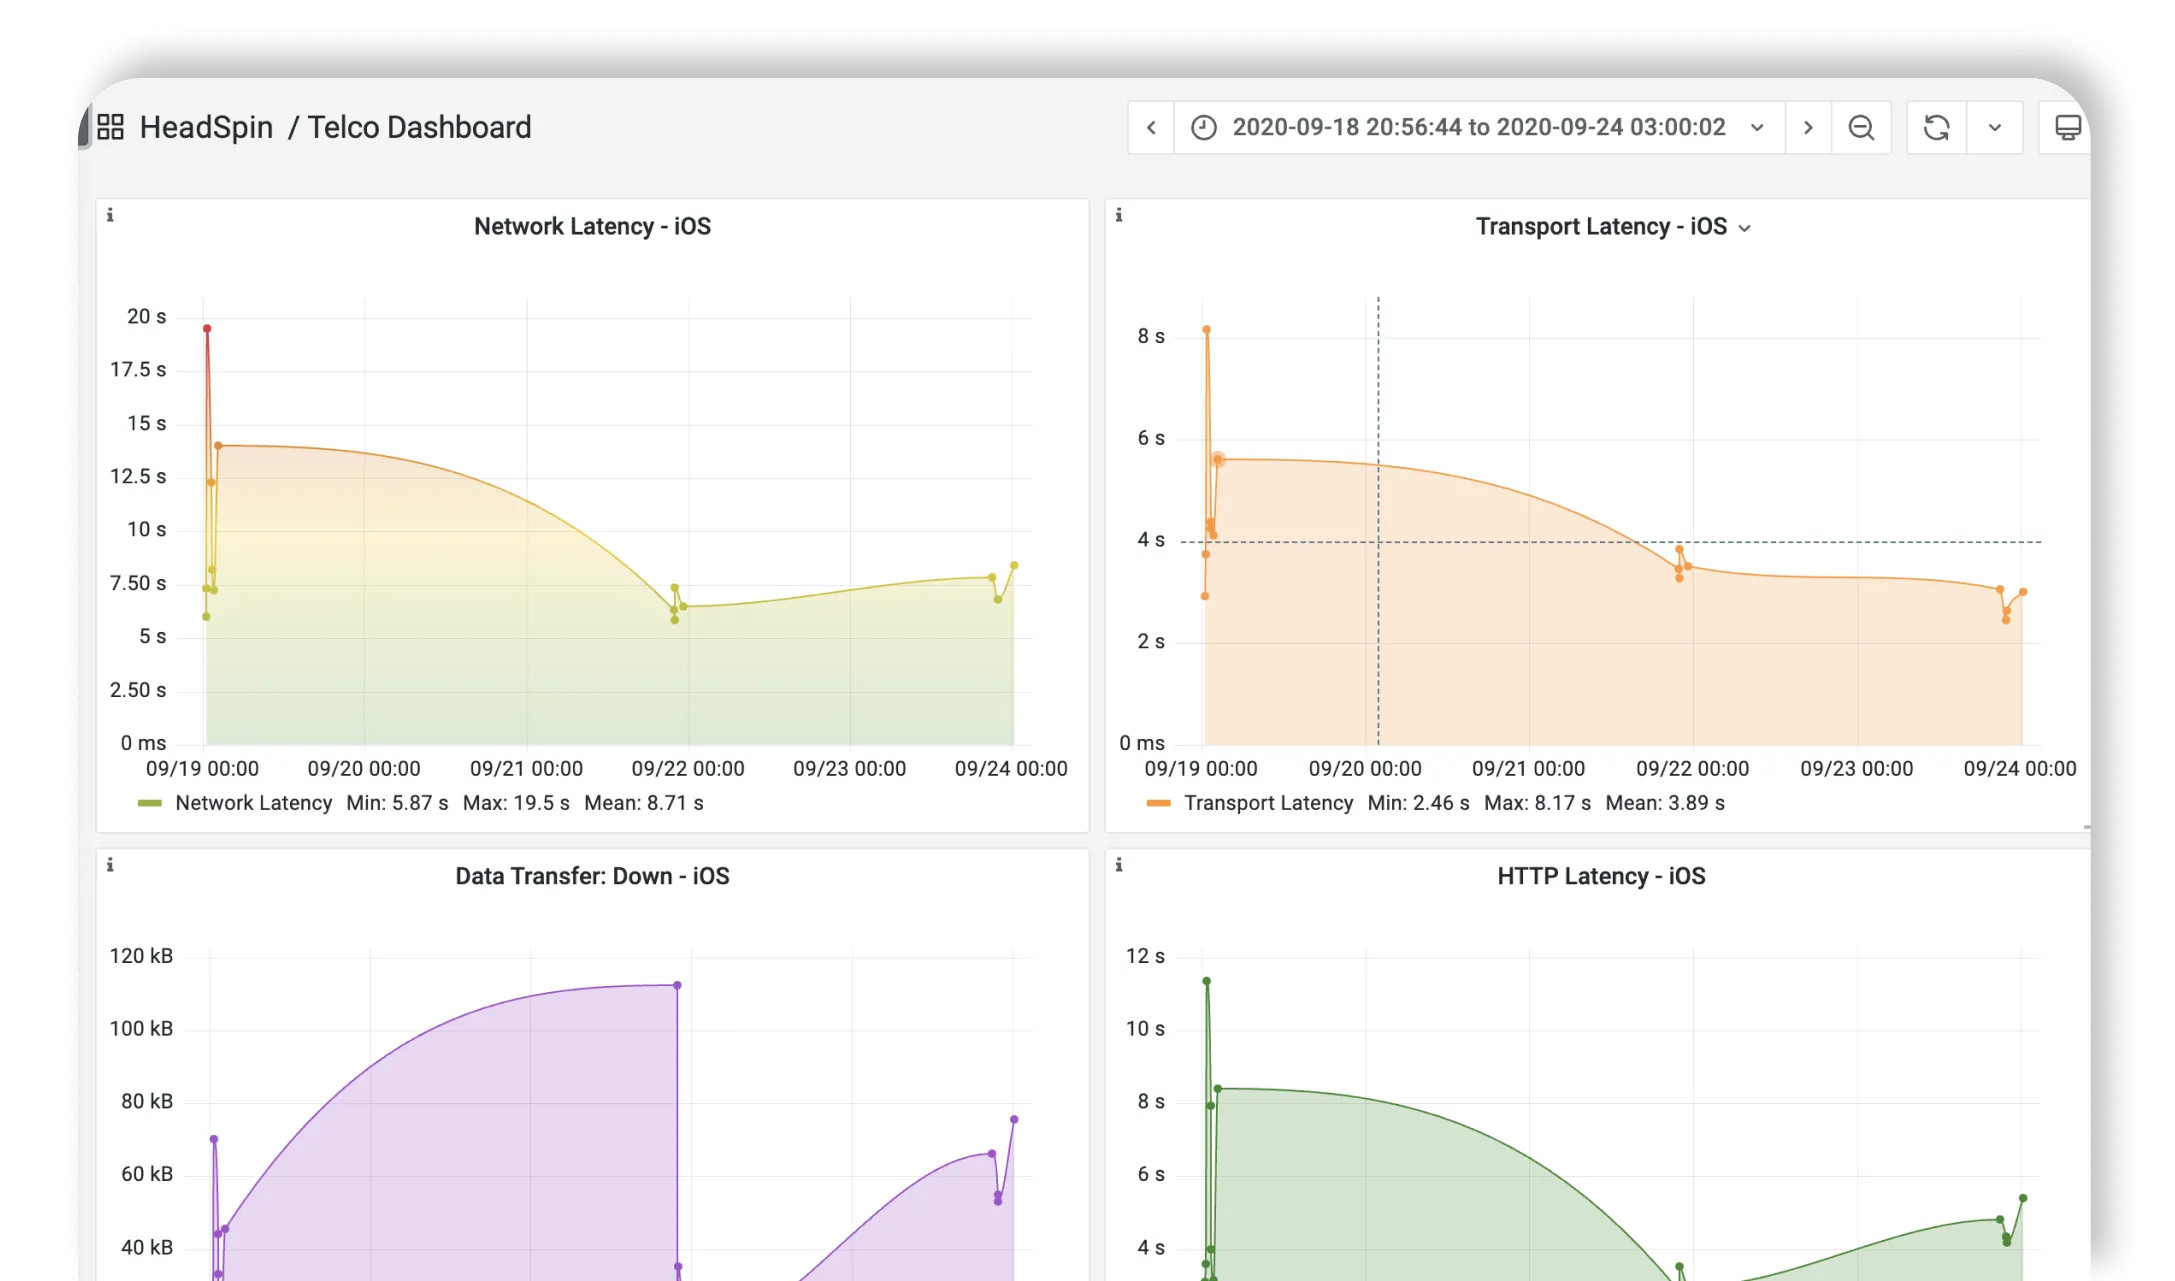
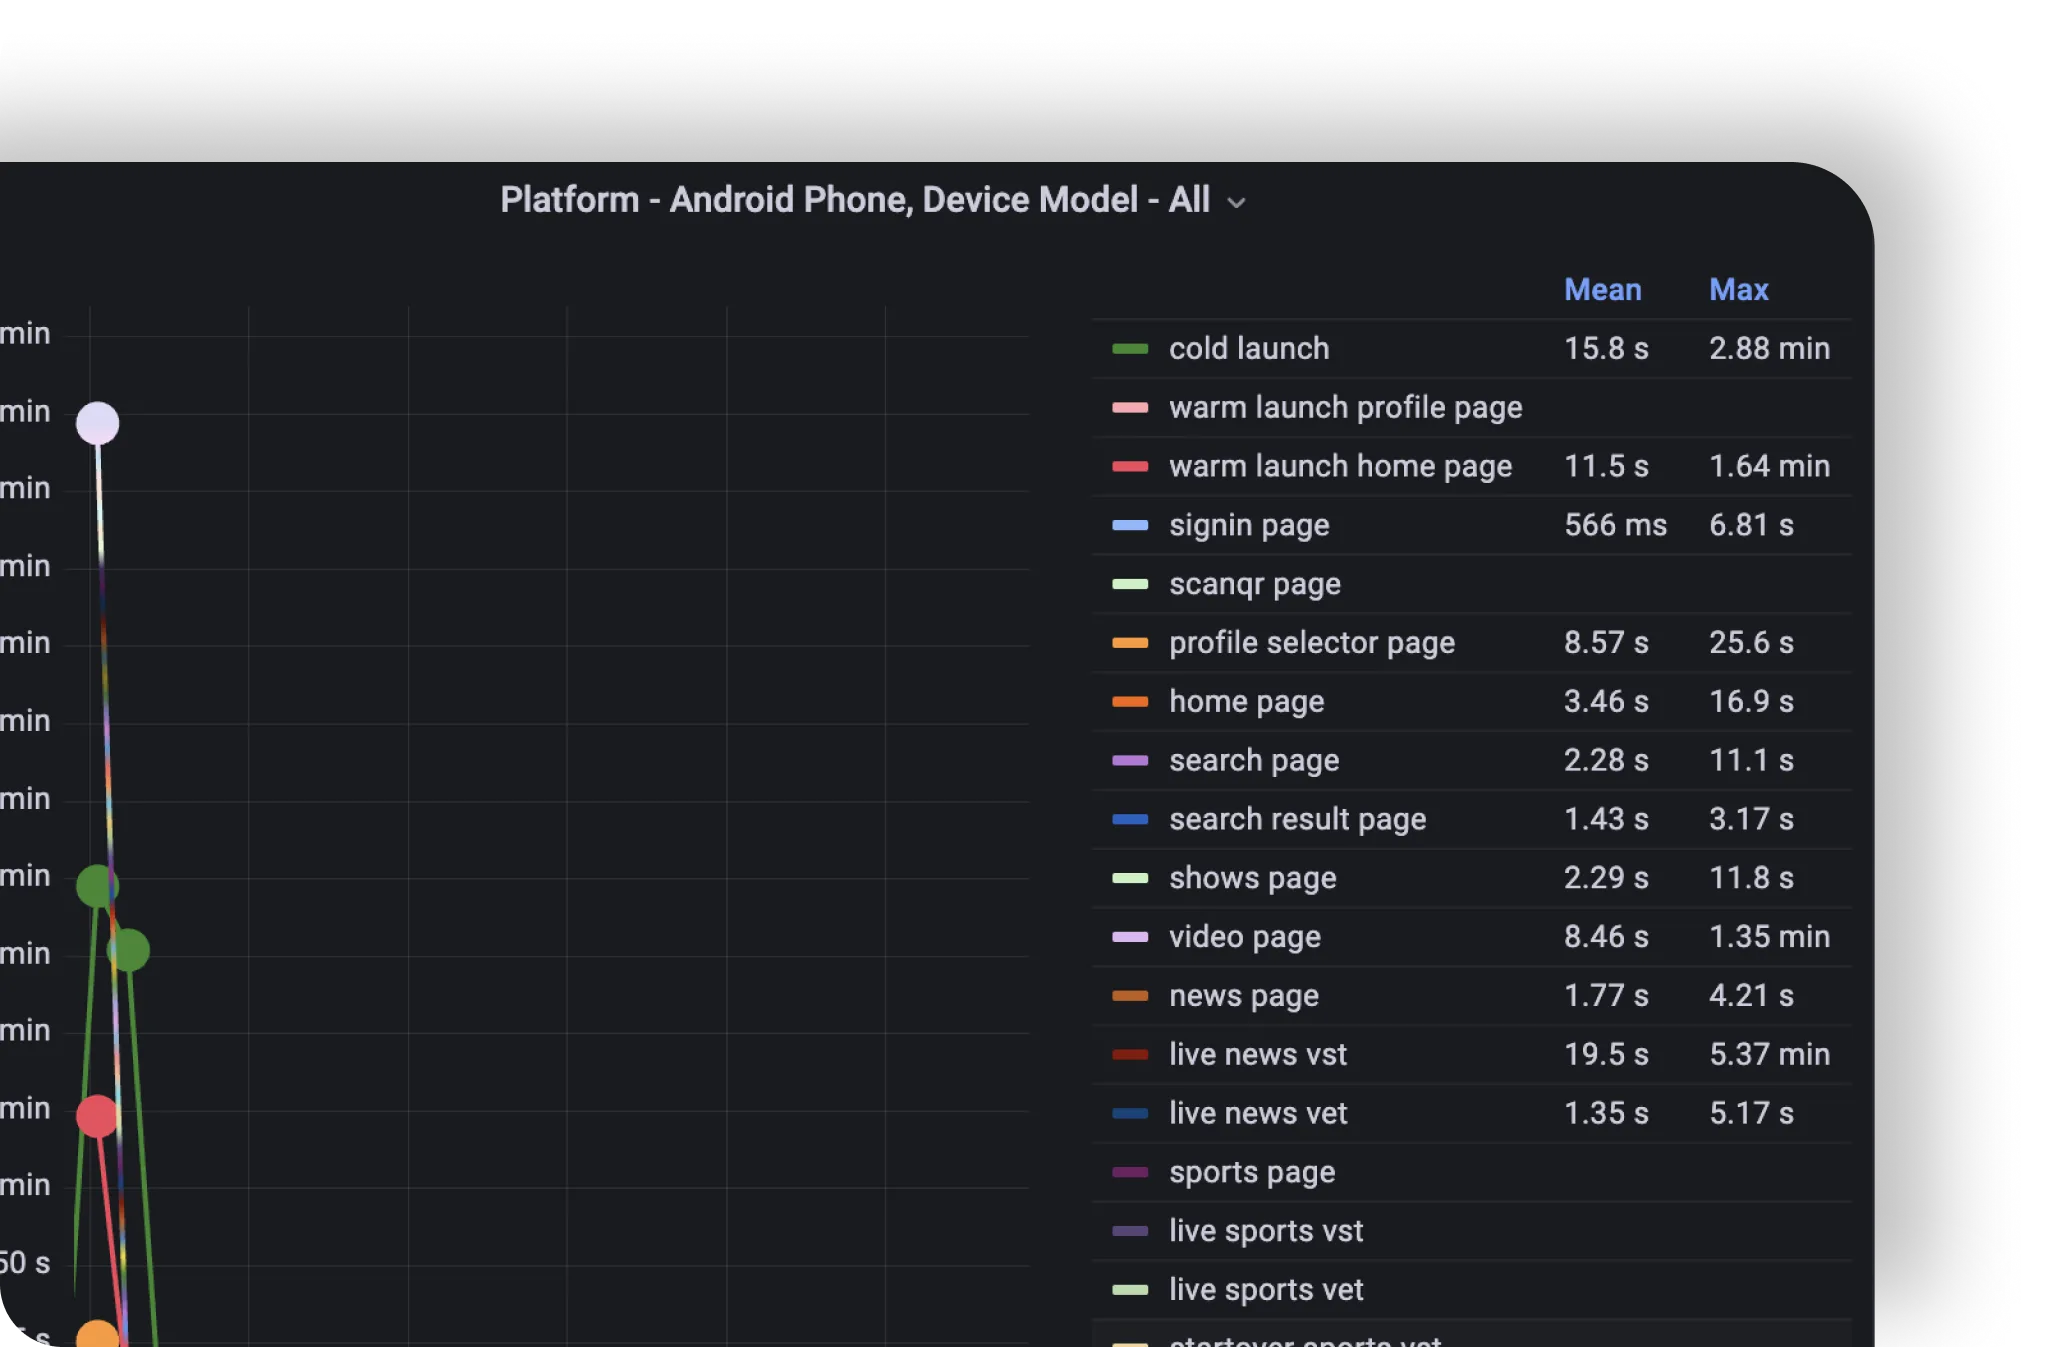
From CPU usage to battery drain and throughput, impactfully visualize and compare multiple sessions simultaneously and track the full performance picture in one view.
App, Device, and Network KPIs

Advanced Filtering & Slicing

Filter metrics by device, OS, build, region, time, or network for highly targeted visibility.
Advanced Filtering & Slicing

Custom Alerts via Grafana

Set thresholds (e.g., if battery current increases by 100 mpl) and trigger alerts to your preferred channels, including Slack, email, webhook, and more.
Custom Alerts via Grafana

Self-Service Dashboards & Peer Benchmarking

Utilize the built-in Grafana UI to generate custom dashboards that analyze test data and benchmark performance against peers, identifying gaps and improving efficiency.
Self-Service Dashboards & Peer Benchmarking

Ready to enhance performance monitoring?

Stop Spinning. Start Testing with HeadSpin!