
AI that executes, validates, and self heals

Affordable Real Device Testing for Emerging Teams

Affordable Real Device Testing for Digital Enterprises

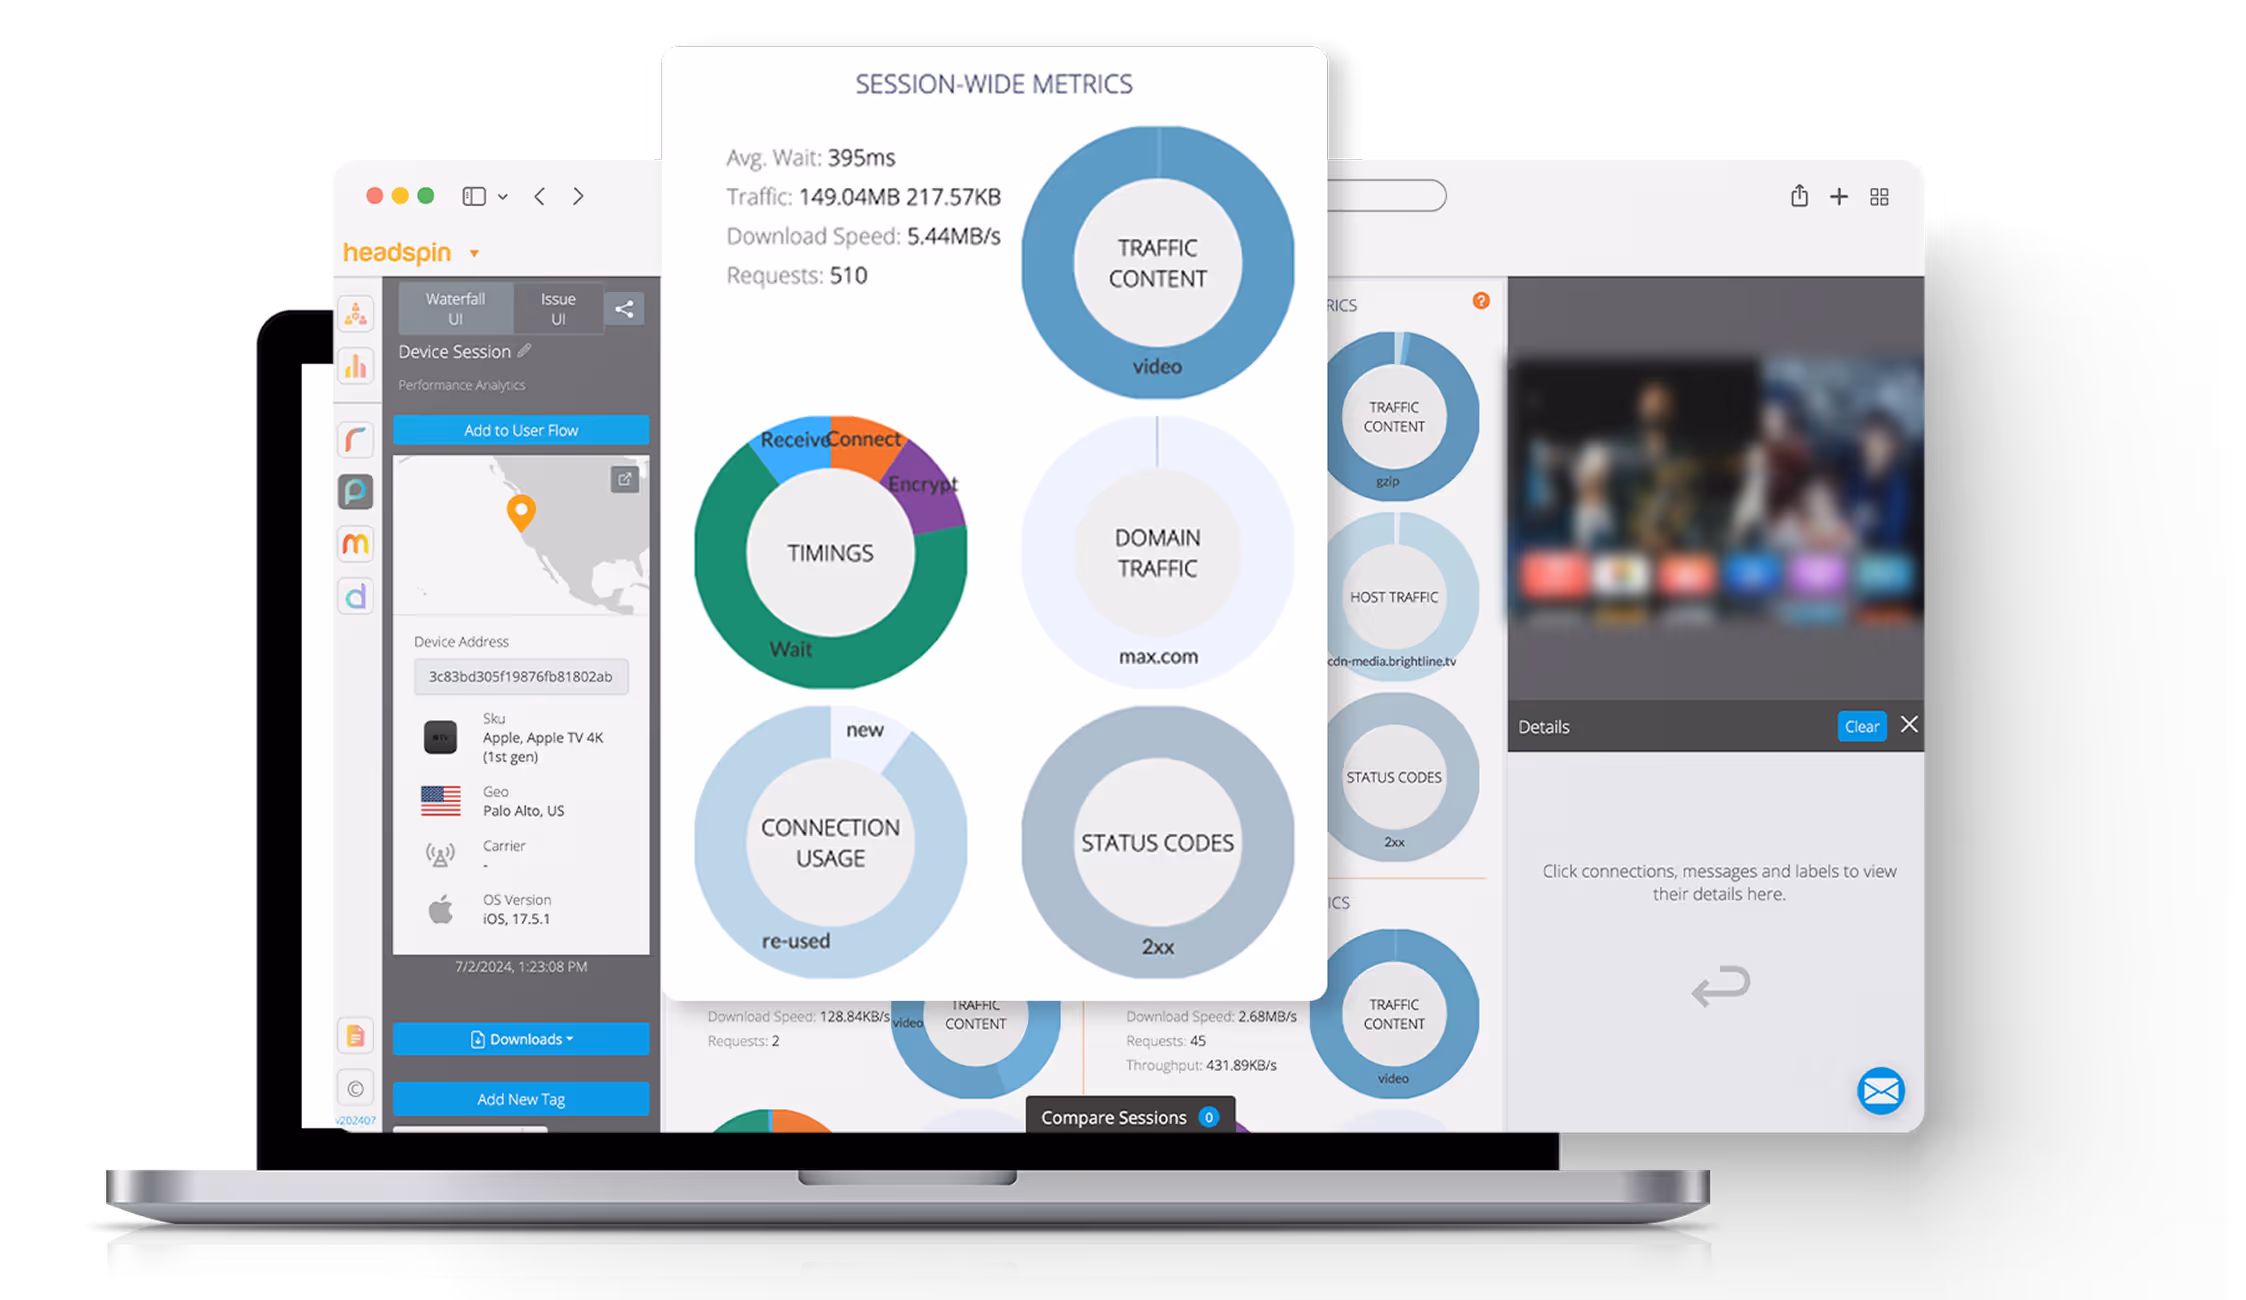
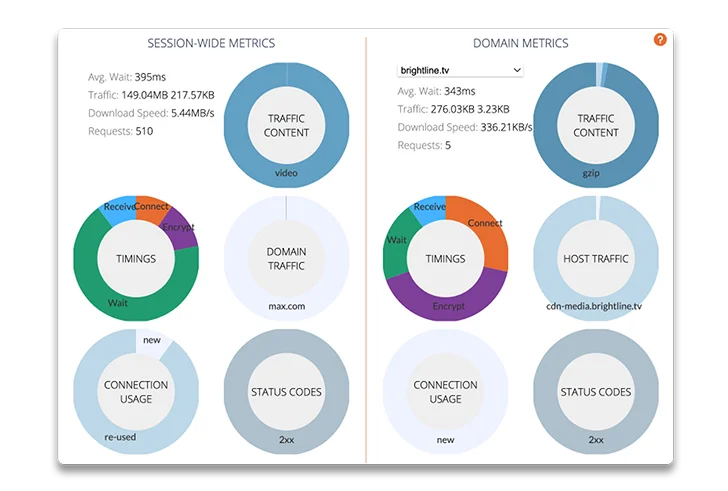
The Ultimate Solution for a Powerful Blend of Functional & Performance Testing!

Centralized mobile test execution in cloud
.png)
Enhance Your Accessibility Testing With HeadSpin

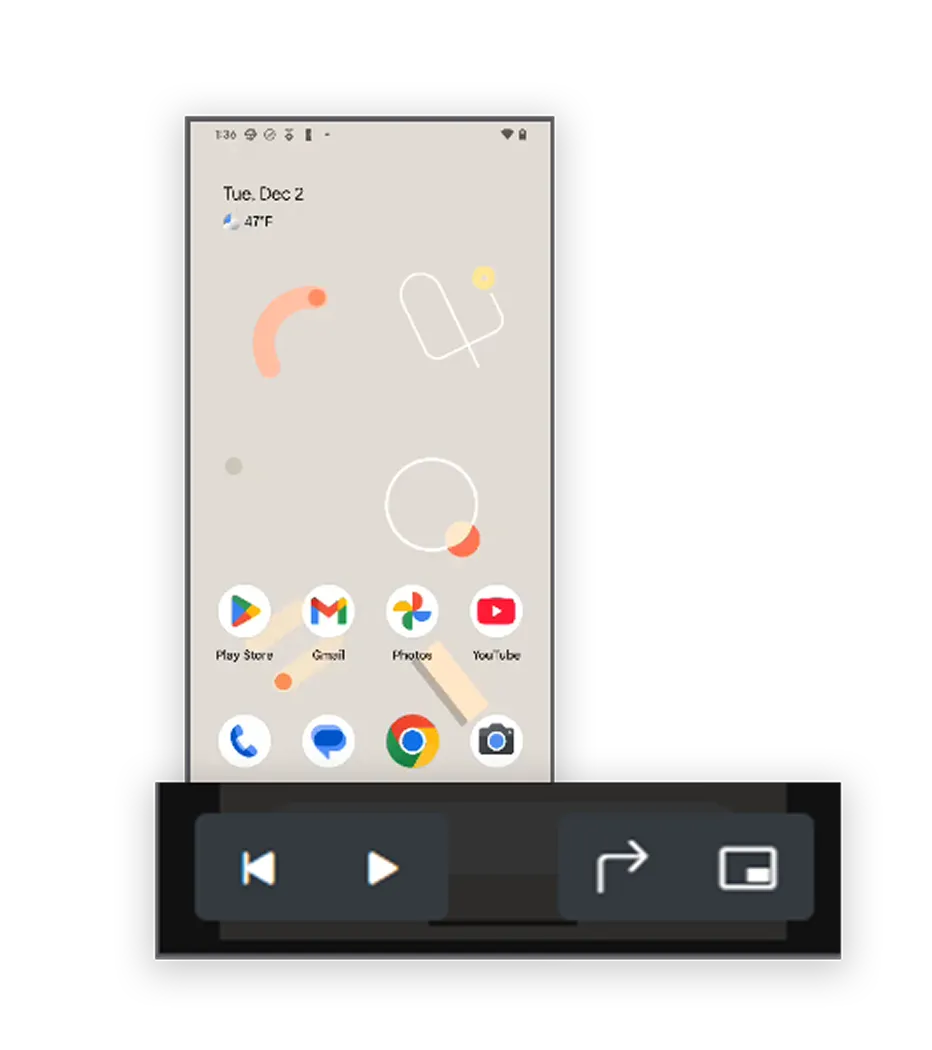
Automate camera-based testing


.png)


.svg)


.webp)
.webp)


