.png)


AI-Powered Key Takeaways


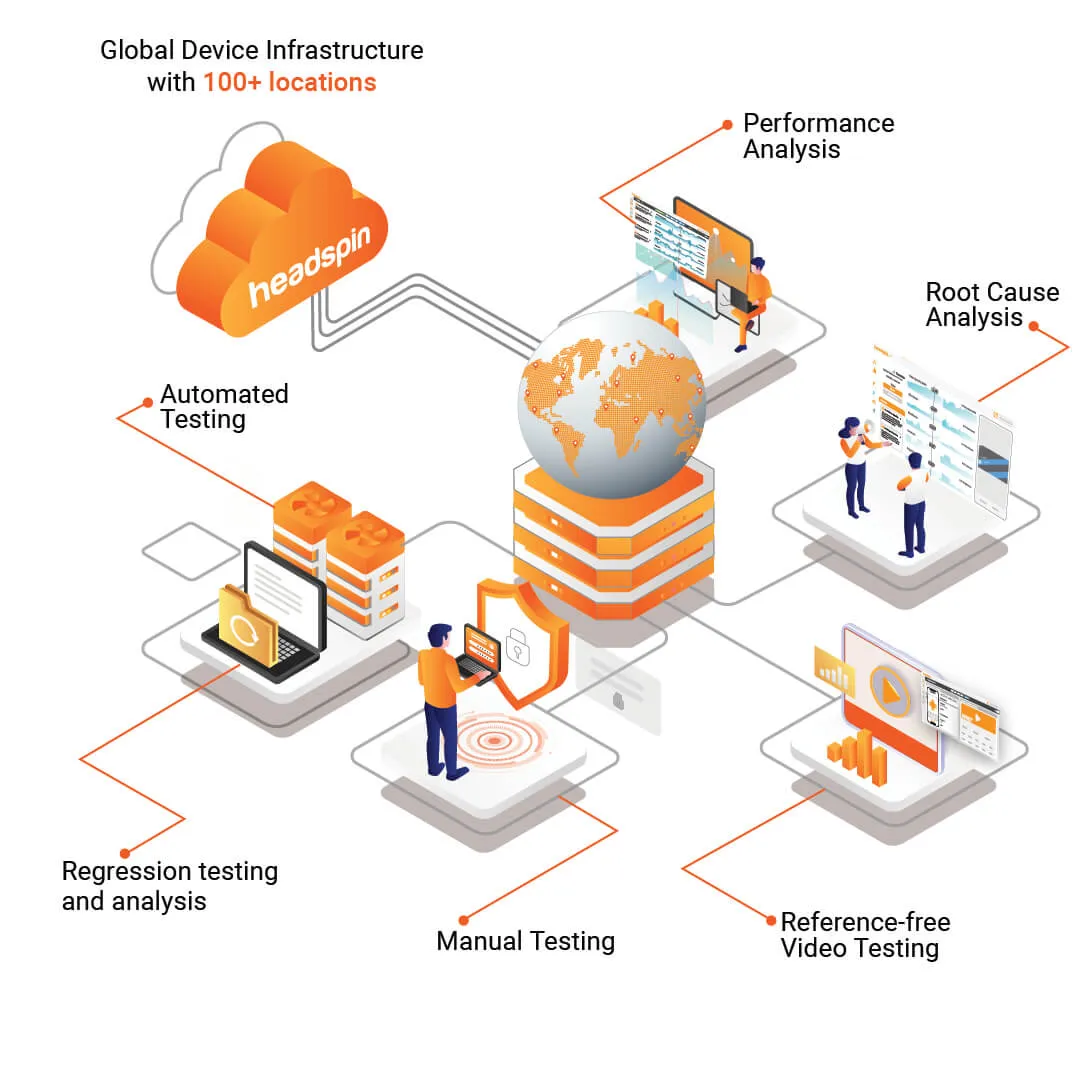
Nathan: Welcome to the HeadSpin platform. We have test devices in more than 50+ locations worldwide. And from the comfort of your browser you can use real Android and iOS devices on carrier networks for example for my account.
I have a wealth of devices to choose from.
In Asia-Pacific, Europe, Middle East, Africa, Latin America, and North America using devices is very simple and straightforward. Simply click on your location of interest and select a device in that region. For example, I’ll select this nexus 5X on the AT&T LTE network and now I’m actually interacting with a real Android device.
That being said any interactions I have with device get translated to touch events and as you can see it’s buttery smooth. We make it very simple to interact with the device and all device operations.
For example, I can install an APK easily by dragging and dropping to upload. As you can see by just simply dragging and dropping my APK, I was able to install it and invoke it on this Android device.
In addition to remote control you can also run automation test on your devices and we support a variety of automation frameworks such as Appium, Espresso, XCUItest and more.
In this demonstration, I’ll run an Appium test on this device with the help of Appium desktop. When you’re running an automation test on a device you put it and read-only mode so it’s reserved for you and you can view what’s happening on the device and the case for Appium, the server logs side by side. In this case, I’m launching the application that I just installed on this device, Firefox Focus.
And that being said, now I have access to the full Appium desktop Inspector and I can actually start recording my interactions with this device and allow Appium to generate the test for me.
Ilya: That’s right Nathan.
As you can see it’s very easy to create these Appium tests or any other tests. And now let’s talk about the CI/CD integration.
So, what you’re looking at here is a great dashboard where every one of these data points represents a build. And every time there’s a new build generated it gets pushed to these real devices and the test are executed in order. And what we’re doing here on that Firefox…what we’re doing here on that Mozilla application basically profiling every single build you can see exactly how long each of the test runs and we can do this to create this trend graph showing build over build, how the speed of each test changes as different code is added or modified. What we see here for example is there is a slowdown where this scenario went from 5.3 seconds to 6 seconds. This being a developer tool we can simply compare this upload against the currently selected one, or the latest, and what we’ll see here is the actual reason why the code change has created a slower situation.
As I was saying you can see here the build is now 6 seconds for this particular test scenario. It used to be 5.3 seconds. Now what we can do here is look at the actual call stack with timing information to see what’s happening. So yeah as you can see here the UI thread runs for 722 milliseconds. And notice this chrome IO thread here is a 252 milliseconds. Now on the other hand we have a slightly faster UI thread at 684 milliseconds. But look at this chrome Io thread it’s actually gotten much slower. So we can clearly see that the reason the build here ran for longer is because of this particular method being slowed down and now developers can look into the details of that.
And again there’s some different test that were being done, but let’s actually focus on what happens during the Cold startup; that’s the time from when the app is click. That’s the time it takes the app to actually launch to the first screen where users can interact with the app. And so if you look at the details here you’ll see that this particular cold startup takes 4.1 seconds. There’s some metrics here about network and disk I/O, but the key is these 30 slowdowns
So, let’s look at those in a little more detail. These are all the different methods which are on the UI thread and they’re actually freezing up the UI thread while they execute. There’s also these things we call hot methods which are basically any background method which is not freezing up the UI thread but it’s contributing to CPO usage more than 100 milliseconds.
Also check: UI Testing - A Complete Guide with Checklists and Examples
So, if I look at any of these initial methods like this on create method you can see we provide a great amount of detail of what exactly happens when this on create method is called. And from this we can see that there is some very specific high-level method calls that take up a lot of time and then down here we can look at the details all the way to the very bottom of the call stack. And again, we’re providing this timing information so that developers can use this to actually improve performance.
Is it possible to take this method off of the UI thread and move it to a background method?
If yes, then you can speed up your called Startup time by doing that. You can also look at the timeline view which shows all the different threads on the order in which they launch and for each one you can actually again pull up the methods that are executed by each thread to get some details on you know for example what’s going on here. So, by using this timeline view or by using the full call stack pairs are able to discern what is making the app slow down and various plan then and perhaps rectify the situation
Nathan: Thanks Ilya.
We also took a look at the theme parks app using HeadSpin performance session. This enables us to take a look at the client server relationship of the application during this test session and HeadSpin AI-based issue detection engine will automatically flag any anomalies and issues that have happened during the session.
This is what happened during the same application for Android.
As you can see here, we have a waterfall the view of what happened during this application. And as I scroll through this, we can see the exact UI State of the application at any given moment time there this test session.
From here we can take a look at issues such as areas of low page content. These are areas of little to no clickable elements on the screen. And as you can see here on cold start it took 7.32 seconds for the application to launch.
And here we can see the black screen.
Likewise, we can see an incomplete UI state from taking a look at this you can also look at errors that are happening. For example, HTTP errors. And if we click on this information, we can see failed API transactions that occurred.
In similar fashion, we can let the AI based issue detection engine guide us through any of the issues during the session and it helps us pinpoint the needle in the haystack with respect to offending API calls and help us hone in on for example slow server calls as well as also slow downloads such as this download that impact the client by over 1 minute and 30 seconds.
What’s very powerful about this is that in addition to detecting issues we can take a look at the requests and response headers to dig deeper…deeply inspect what’s happening in a given session.
In addition to our waterfall UI we also have a burst UI for taking a look at this data the burst UI helps us answer the question of given the fact there are numerous issues where I start first. The idea here is that you can visually see what is the area of greatest impact of your application and when you click on it will show the same issues that we saw earlier as bubbles on an impact curve to allow you to understand the peaks and valleys of your applications client server performance. These are the same issues that we saw earlier in the waterfall view but now presented in a card format and they’re already sorted for me. So for example the first card will represent the area of greatest impact. This was a slow download that we saw earlier that was taking one minute and over one and 30 seconds typically to complete. I can see the composition of this transaction. I can see for example that the majority of it was time that the client spent downloading the data.
And this concludes the review of the waterfall and burst UI
FAQs
1. What is performance testing, and its significance?
Performance testing is testing an app’s performance metrics like speed, responsiveness, and reliability under a high workload. Higher app performance leads to better customer reviews, higher revenues, customer satisfaction, and a positive impact on the brand image.
2. Is load testing the same as stress testing?
Load testing ensures that your application works as expected under expected usage conditions. On the other hand, a stress test, on the other hand, is done to identify the breaking point of your application.
3. What are some common performance bottlenecks in mobile apps?
Some of the most common bottlenecks in mobile applications are
- Memory usage
- Network speed
- CPU utilization
- OS Limitations
4. What are some common methods to improve mobile app performance?
Some of the most common methods to improve mobile app performance are:
- Reduce the application size
- Optimize the memory and disk usage
- Update the image and screen sizes to optimal performance
- Test on lower-end phones and slower network speeds
- Use AI to find latency points and eliminate them


-1280X720-Final-2.jpg)