


.png)


.png)


-1280X720-Final%20(1).jpg)
AI-Powered Key Takeaways


HeadSpin’s Regression Intelligence is a fully automated solution and provides a set of capabilities to help you discover regression early and improve quality assurance. This article is the first part of the two series. The goal is to give you a practical idea of how Regression Intelligence works by guiding you through creating custom KPIs and setting regression alerts. This knowledge is the foundation for understanding the more advanced topics covered in Part 2, where we dive into statistics and the more profound product realm. Through this series, you will understand all concepts necessary to utilise Regression Intelligence where applicable and help you maximise your investment. For those looking for basics, please refer to the product page and the following materials:
In this article, we will cover:
- What is a custom KPI?
- Creating a custom KPI?
- What options are available for regression detection and alerting?
- Regression monitoring with Grafana
- Regression monitoring with Watcher
- Conclusion
What is a custom KPI?
A Key Performance Indicator (KPI) is a quantifiable indicator of performance that you have identified as important to measure the success of your application. HeadSpin supports data collection from more than 120 data points. You choose one or more KPIs from the standard set that HeadSpin supports out of the box, or create your own KPI if the KPI you need is not found in the default setting.
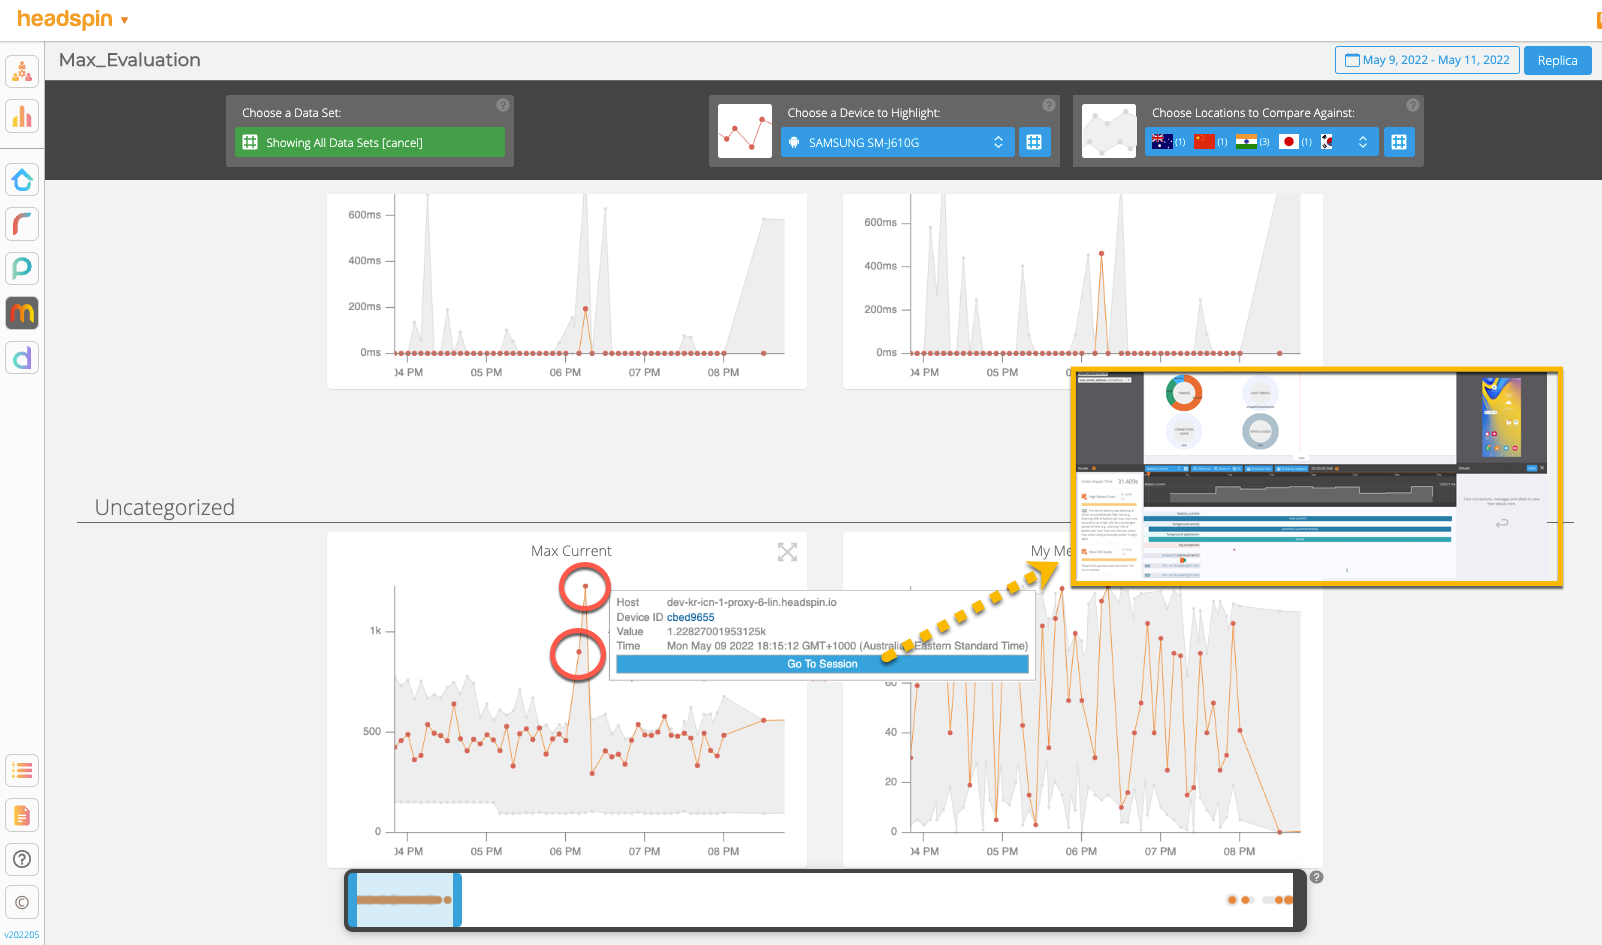
See how beautifully the data collected is plotted. The “Max Current” values collected from multiple sessions from the selected “Samsung SM-j610G” device are highlighted in the orange line. Looking at the trend, you can easily find spikes in the data set where the anomaly occurred and correlate them with over 100 KPIs at a glance. You can also jump to an individual session to open the detail page or switch highlights by selecting another device or region. For more details about Performance UI, see Performance Monitoring UI.
This is just an introductory feature of Regression Intelligence. In the following, I will cover how to create this “Max Current” KPI and automatically receive notifications when an anomaly or regression is detected.
Creating a custom KPI
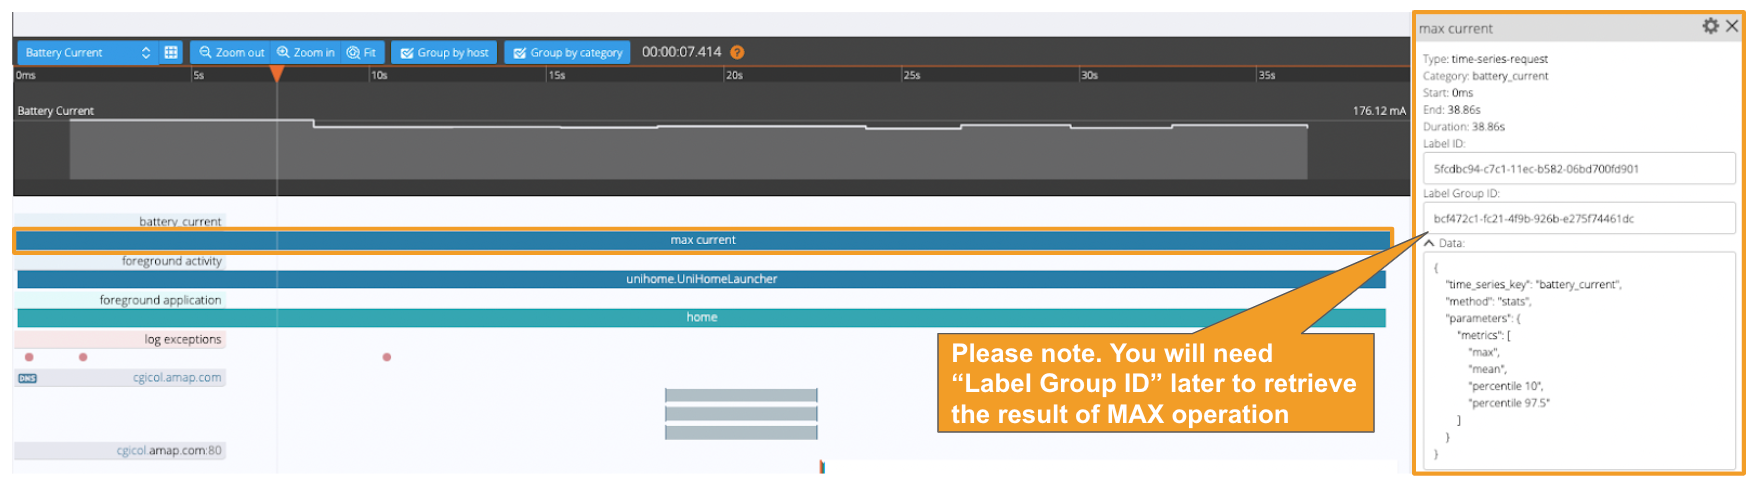
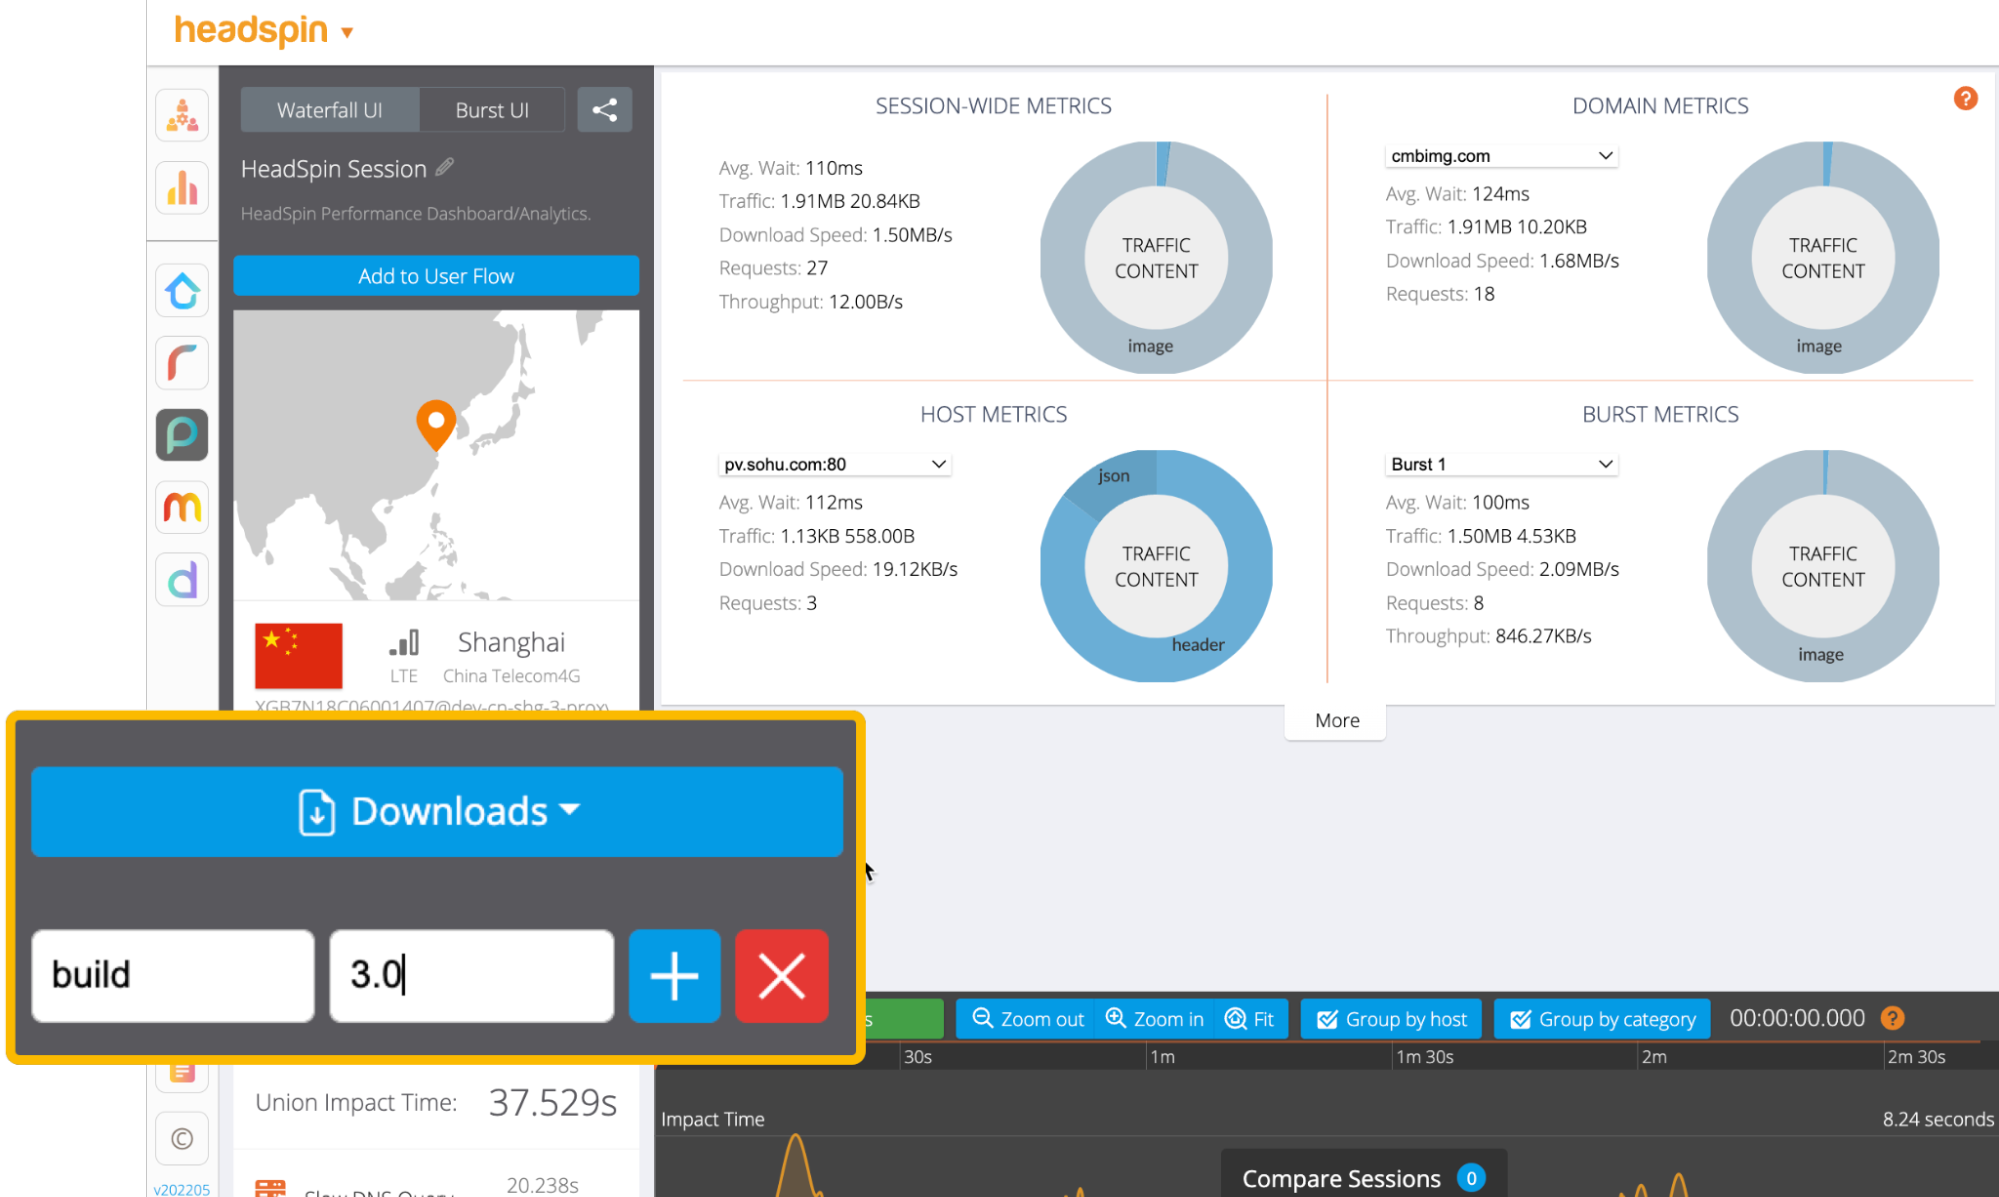
Here, you will create a custom KPI called “Max Current”. Let’s start a session and collect data from the remote control. Here is the instruction. After the session is recorded, for this exercise, you will use summary statistics to get the max current by adding a “time-series-request” label as shown below.
Adding a time-series-request (stats) label via Web UI

The label capability enables you to annotate the collected data and aid your analysis. There are multiple ways to create labels: by calling Session Label API or LOG functions, so labels can be created while the app or automated test is running. You can also use the COPY method to duplicate labels across sessions.
Once the label is added successfully, you will see the result below.
The following API will create the “time-series-request” label via Web UI:
Adding a time-series-request (stats) label via API
To obtain the MAX calculation result, the Session Analysis API below must be called separately. The result cannot be obtained from the Web UI as of this writing. Specify the Label Group ID, which you noted earlier, as a parameter.
The following API is returned. In this case, the maximum value observed in the electric current in this session is 176.116mA.
Next, you will use the Performance Monitoring API and add the retrieved value (i.e. 176.116) to a user flow. A user flow is a data repository for storing session data originating from the same user action. Typically, you will create a flow for each critical user operation (e.g. cold startup, shopping cart, payment transaction) where any failure triggers user frustration.
Adding a custom KPI “Max Current” to a user flow via API
If the data collected through a session is not valid, set the “status” to either "failed" or "excluded" to filter out the session from the analysis.
That’s it. Here, we learnt how to create a “Max Current” KPI. Next, we will set up regression detection and alerts for this KPI.
What options are available for regression detection and alerting?
There are two approaches available; one uses Grafana, and the other uses Regression Intelligence. Depending on your use case, you will need to know when to use which depending on your use case. See below are some guidelines:
Grafana
- Supports various charts and alert options (e.g. email, webhook and more) that work on any KPIs, whether aggregated or not.
- Excellent choice to visualise the relationship between different KPIs and discover hidden insights in the population.
- Knowledge of SQL and data representation skill are required.
- Fundamentally makes the detection of an anomaly session easier.
Regression Intelligence
- Supports the trend line view and email alert that works on network-based or duration-based KPIs (aggregated only).
- The goal is to predict the overall failure rates from the collected samples if the product were shipped as-is.
- Knowledge of statistics is required.
- Fundamentally makes comparisons of 2 data sets easier.
Not intuitively understandable? In the following, I will walk you through two use cases to understand these differences visually.
Regression monitoring with Grafana
Here, you will learn how to trigger an alert when the electric current observed during a session exceeds 800mA. For this exercise, you will use the “Max Current” KPI mentioned earlier. Grafana is the right choice for this task as neither statistical processing nor data aggregation is required. It monitors all sessions and notifies when an anomaly with the “Max Current” KPI is detected.
The steps below assume you have created more than one session with the “Max Current” KPI stored in a designated user flow.
Setup Steps:
1. Open https://ui.headspin.io/docs/grafana-ui and follow the instructions to activate the Grafana feature.
2. Navigate to a user flow where sessions with the “Max Current” KPI are stored.
3. Follow the illustrated steps below and export your user flow to the Postgres Replica database.
4. Navigate to https://grafana-dev.headspin.io/grafana/login
5. Create a new dashboard.
6. Create a new panel similar to the image below.
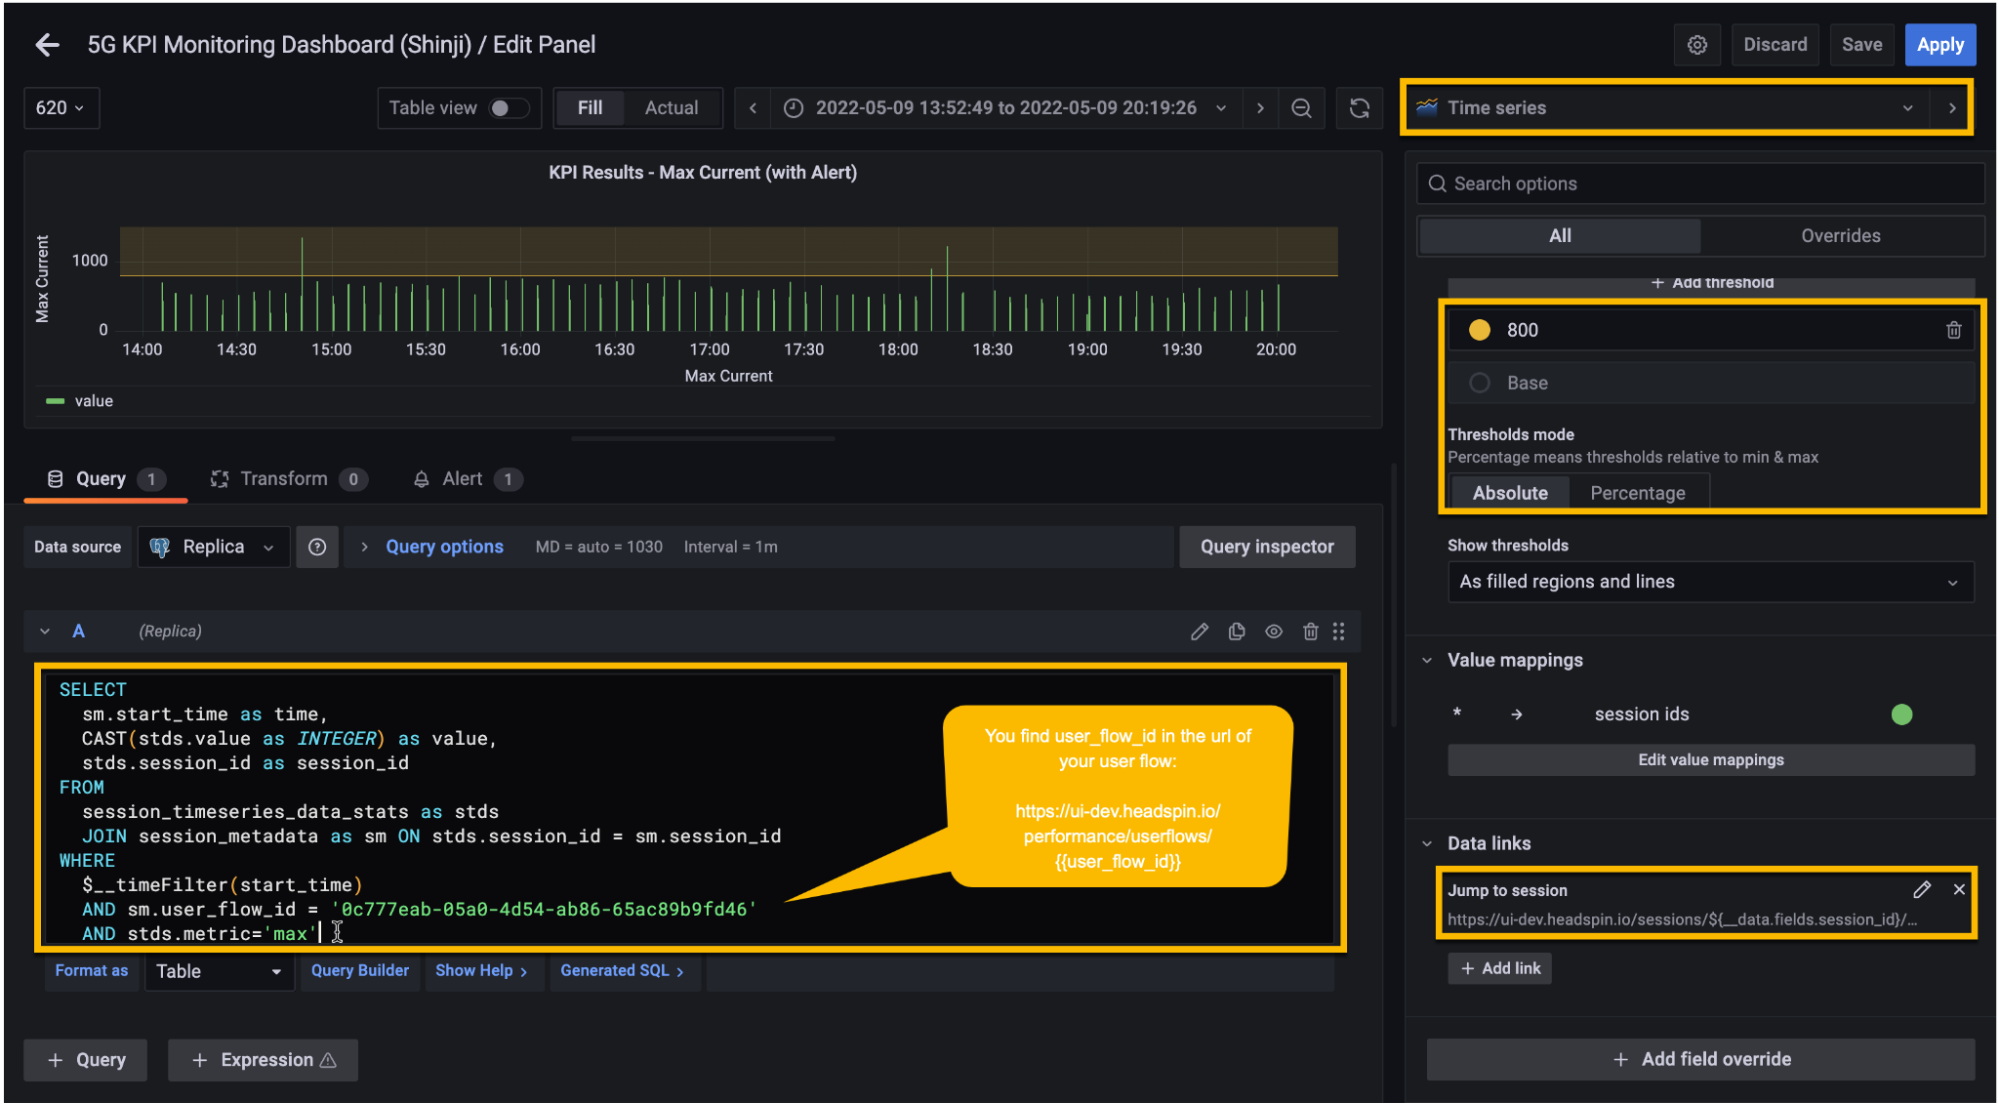
7. Optional: Create a data link and set it to
“https://ui.headspin.io/sessions/${data.fields.session_id}/waterfall”. With this,
you will be able to jump to an individual session of your interest.

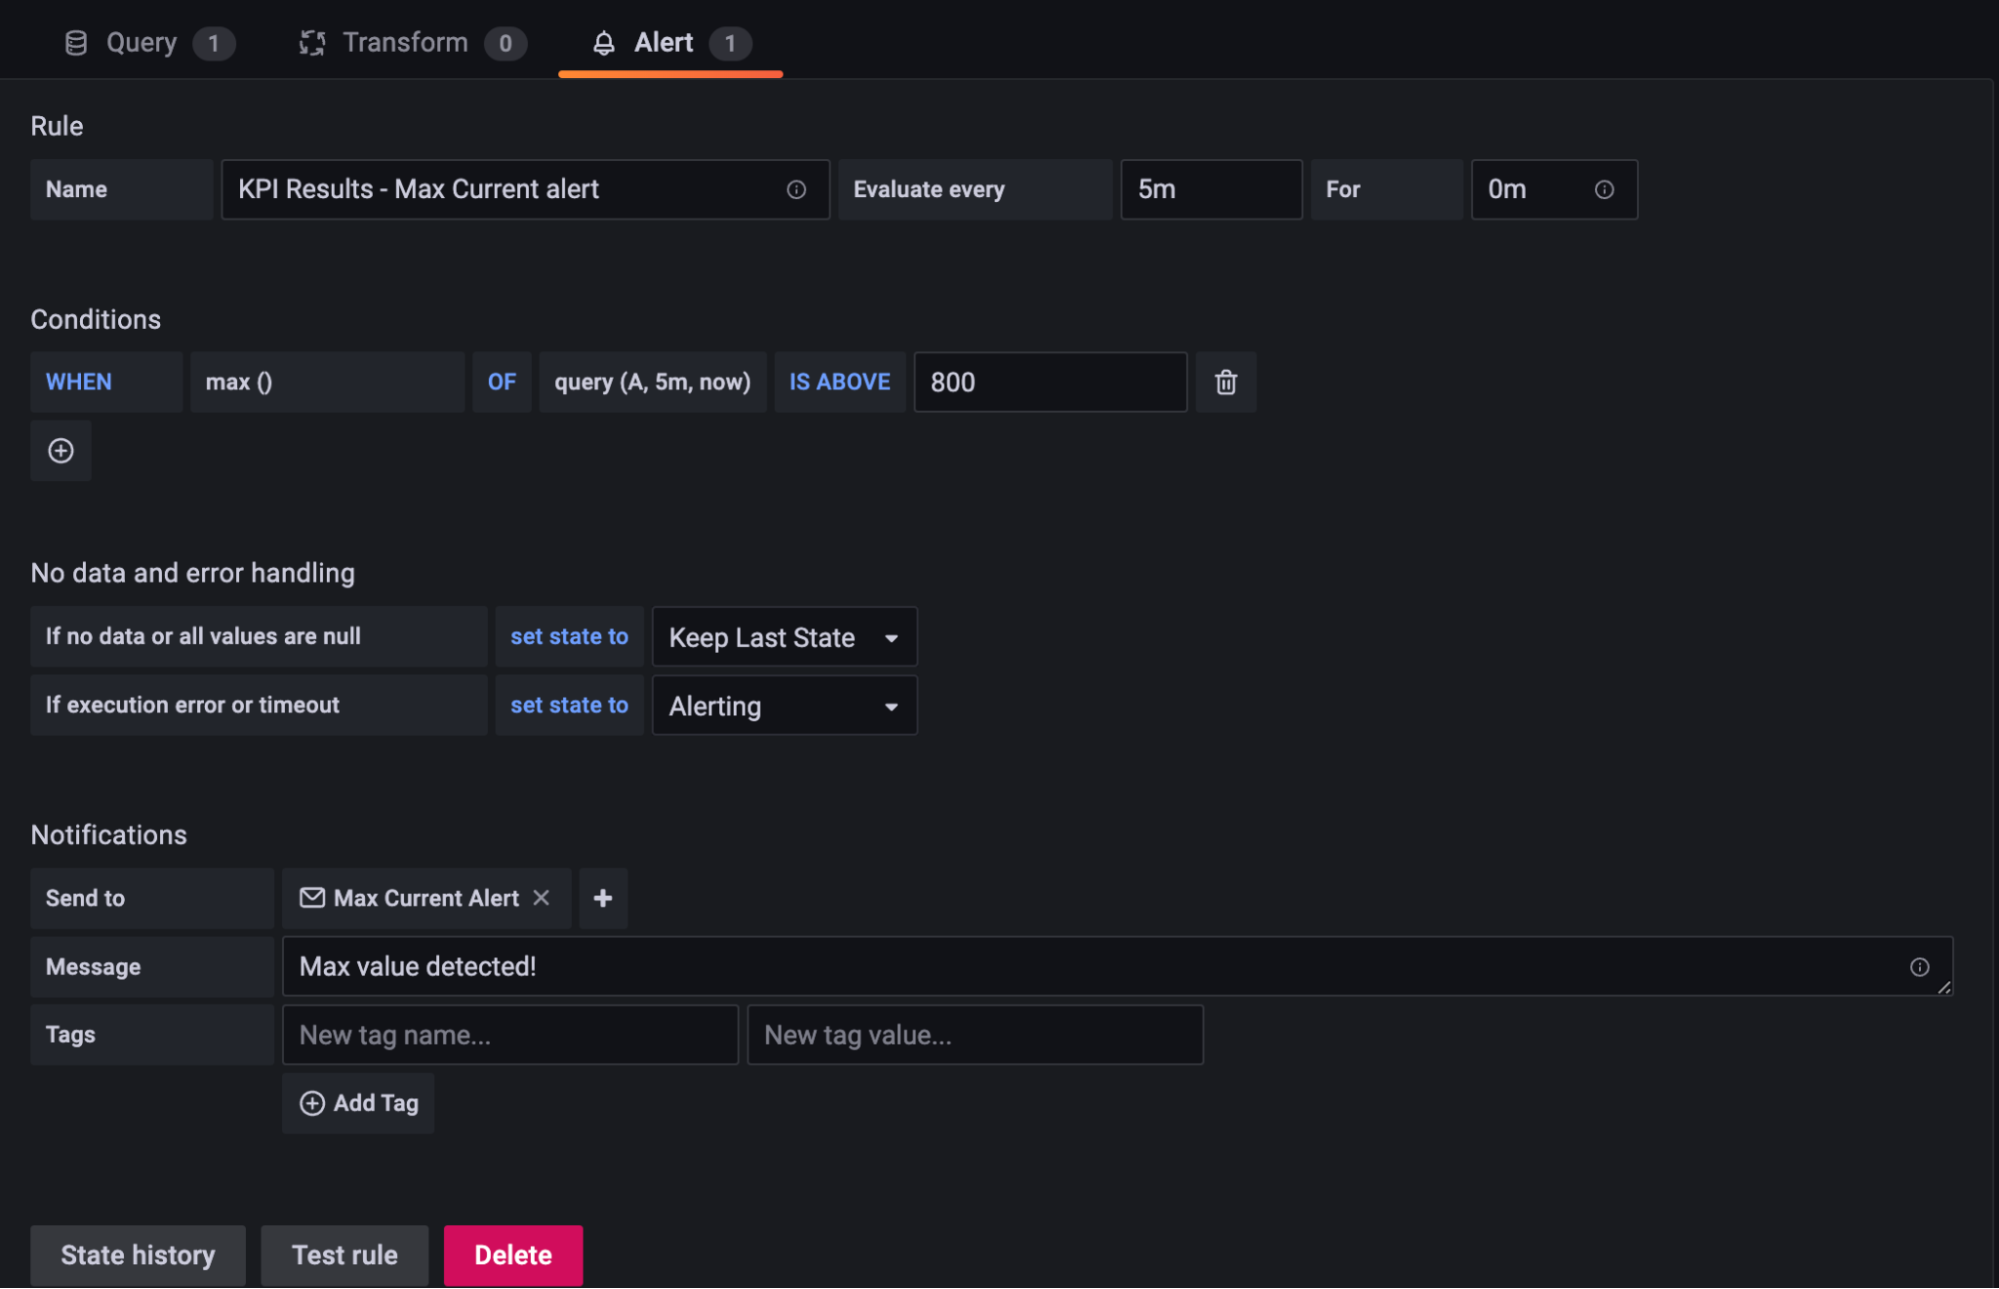
8. Set an email alert. Below is an example configuration
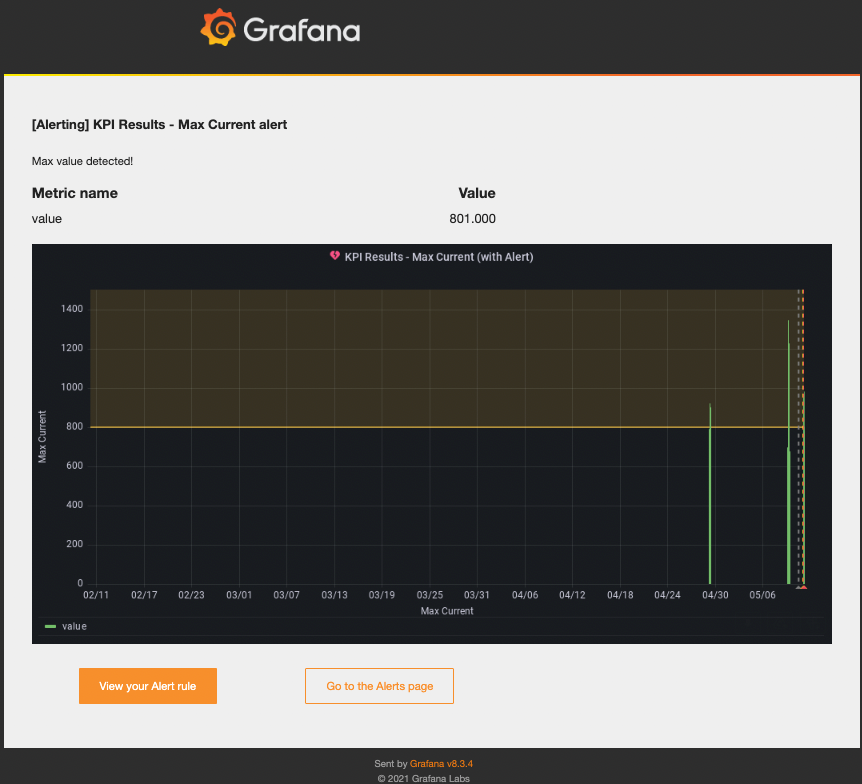
9. Save and done. The final output should look like the below.
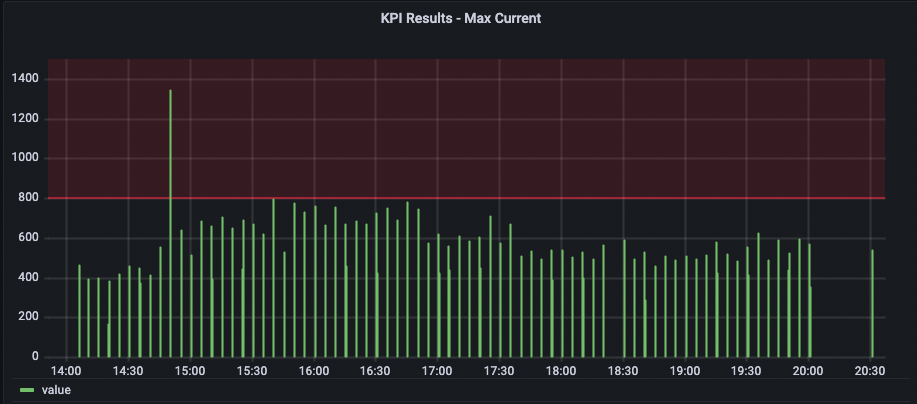
10. You will receive an email alert when Grafana detects a session with a “Max Current” KPI greater than 800mA.
Congratulations! With this simple use case, Grafana is sufficient. SQL Knowledge is required, but once the setup is done, you can let Grafana monitor regression and you focus on other priority tasks relevant to your business. Grafana supports various graphs, so explore live samples here and imagine where else you can utilise this approach.
Next, we will look at another use case where Regression Intelligence is best suited.
Regression monitoring with Watcher
Here, we want to compare data collected from two different builds of your application, compute the average total time where each build exceeds 400mA, and trigger an alert if the total time of the newer build increases by 10%. In this case, use Regression Intelligence for the reasons below:
- Grafana doesn't support the use of percentages for thresholds.
- We need to find statistically significant differences in a large population, representing your entire customer base, with time length as a unit.
- We want to segment the collected data from various perspectives (e.g. build, device, region, tags) and perform comparisons and analyses.
- It is not practical to alter SQLs or panel settings in Grafana every time a view needs to be added or updated.
It is not easy to understand without seeing it, isn’t it? Let’s deep dive.
Setup Steps:
1. Start a session and collect data from the remote control. Here is the instruction.
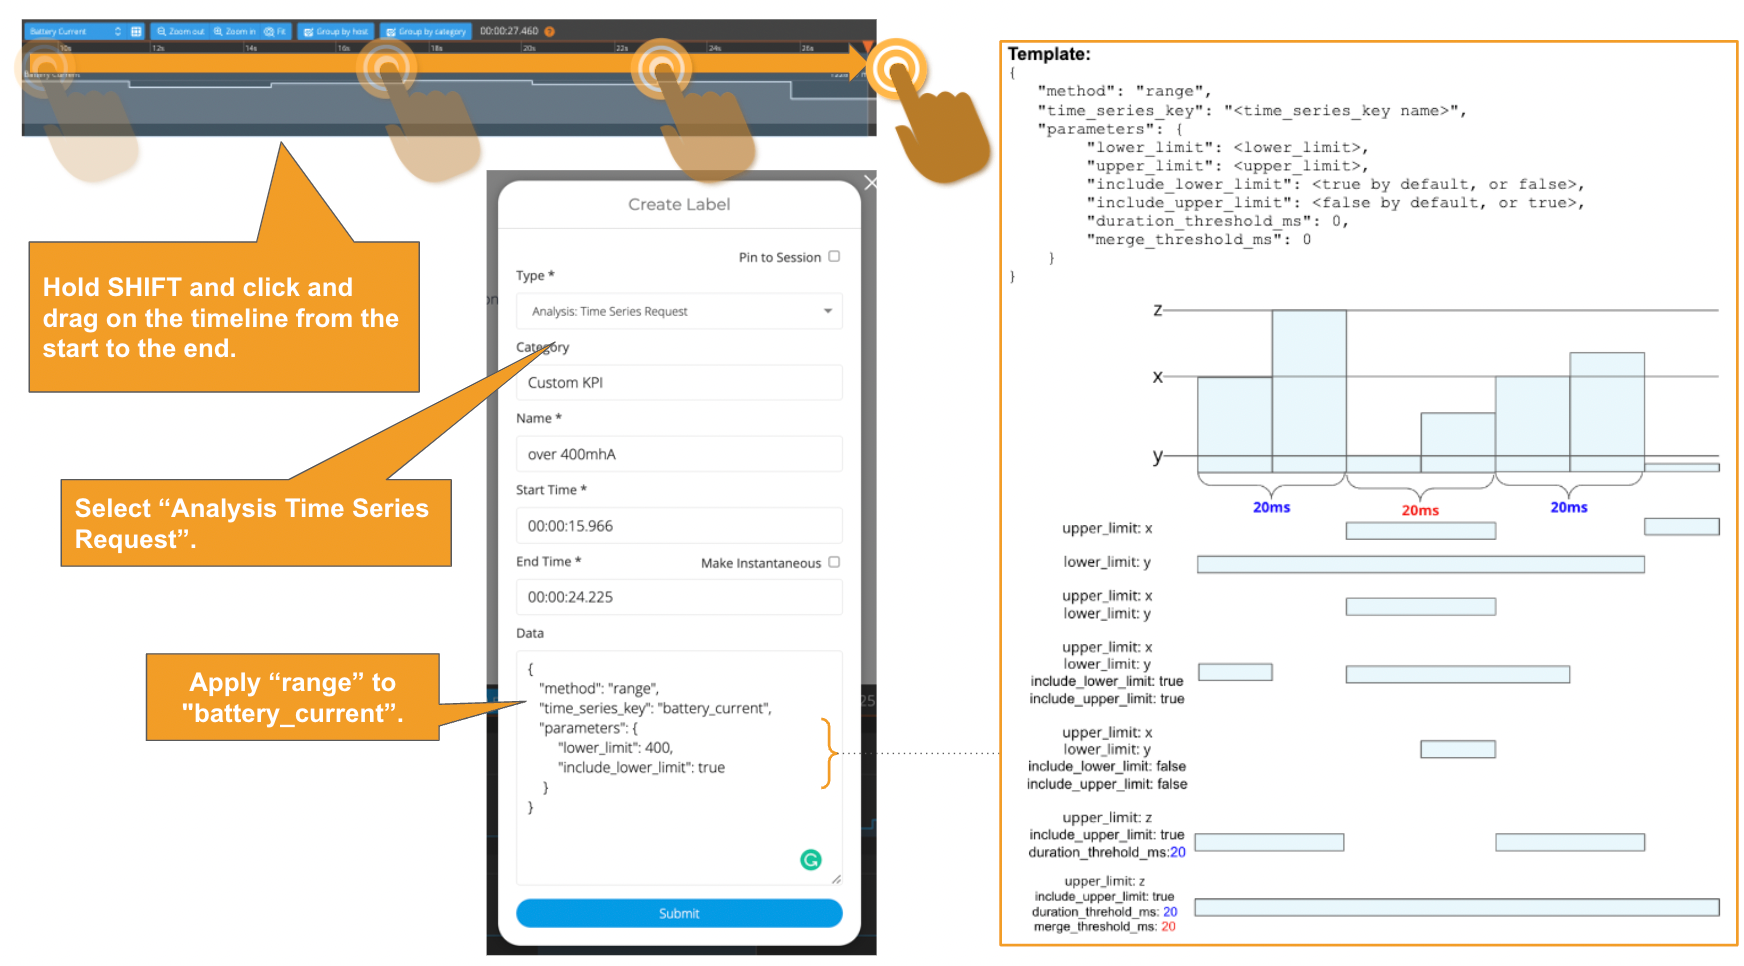
2. Label the locations where the current value is greater than 400mA.
For this task, you will use the time-series method called “Range”. See Time Series Data Analysis> Time series data analysis methods> Range. Below is how to do it via Web UI and API.
Adding a time-series-request (range) label via Web UI
Adding a time-series-request (range) label via API
To get the list of available values for the “time_series_key” parameter, call the API below to retrieve the schema.
2. Once the ”time-series-request” label is created, confirm that “time-series-result” labels are automatically generated in the places where the current value is greater than 400mA. You will see a result similar to the one below.
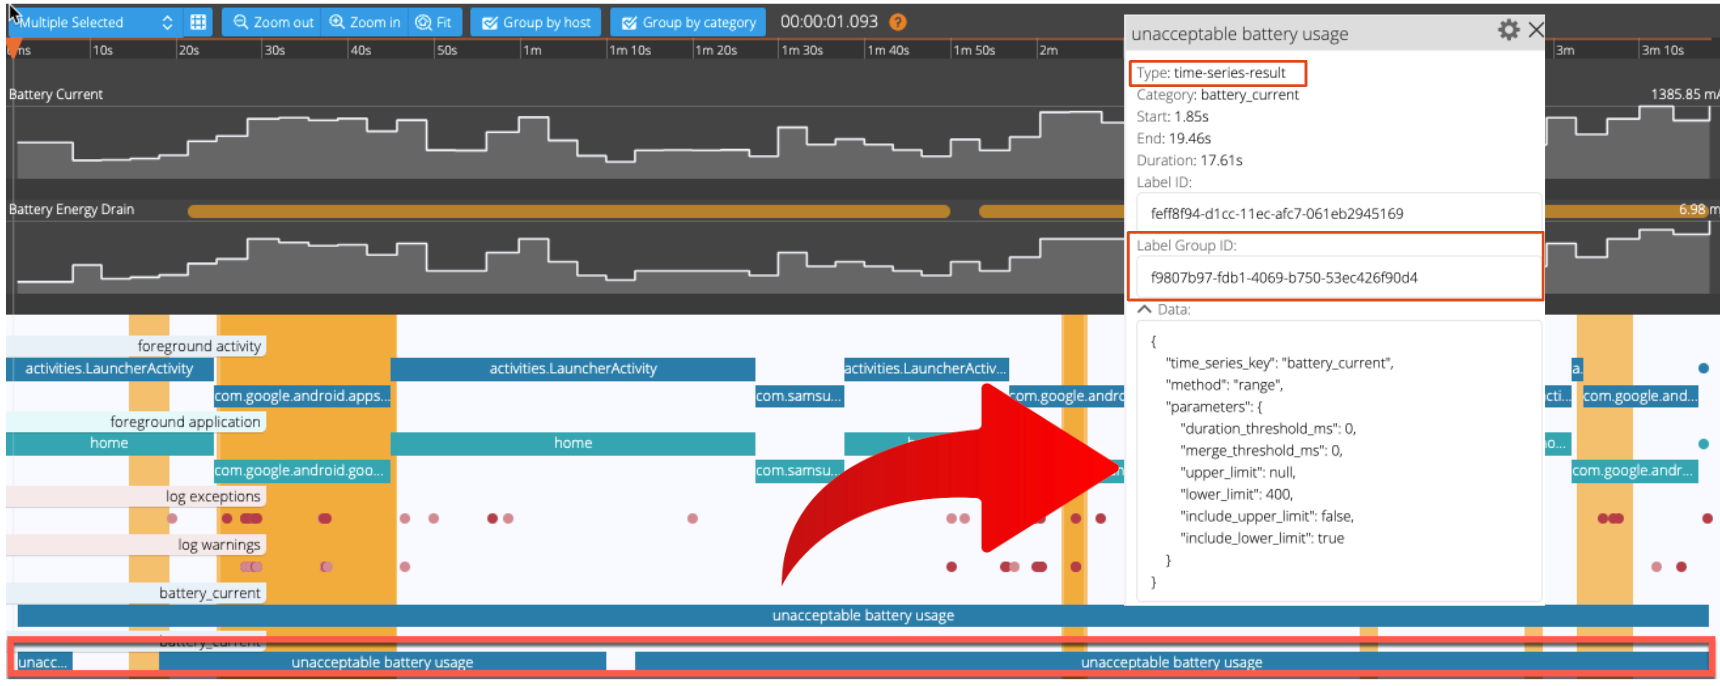
3.Optional: Calculate the total duration of the three labels circled red circle in the picture above. Call the Session Annotation API to retrieve a group of labels under the same Label Group ID, iterate through them, and sum up the total duration of the labels - 57.17 seconds. Run the following API to add the session with the KPI value to your user flow. Remember having done this for the “Max Current” KPI earlier?
Adding a custom KPI “unacceptable battery usage” to a user flow via API
The image below illustrates how the trend of the KPI values is displayed on Web UI. Without this visual aid, it can be difficult to spot or filter out sessions that might confuse your analysis. If you want to be alerted when the "unacceptable battery usage" exceeds a fixed threshold or visualize correlations with other KPIs that do not have time as their X-axis, use Grafana's alerts and data analysis to complement your needs.

4. Add a build tag (e.g. build: 3.0) to the session.
5. Repeat steps 1 - 4 to generate 80 sessions. The following steps assume you have a user flow having 40 sessions with the “build: 3.0” tag and the remaining 40 sessions with the “build: 4.0” tag.
6. Call the regression intelligence API to generate a regression report. Web UI doesn’t allow you to configure the “limit” and “kpi” parameters, so the use of API is necessary here - the default values of "limit" and "kpi" parameters are 15 and “summary.network.regression.”Network Latency” respectively. For Network Latency, we will look deeper in Part 2.
Run a regression analysis via API
There are three points with this API:
Point 1: What is “limit”?
The image below depicts the concept of group ‘a’ and ‘b’ and the impact of the "limit" parameter (e.g. limit=10). Usually, the higher the limit size is, the more accurate, but the longer it takes to produce the report. As a rough estimate, it takes about 25 seconds for a 250 limit and 220 seconds for a 1000 limit.
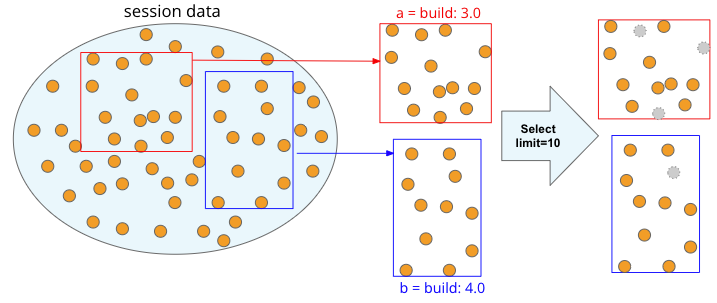
In this example, Regression Intelligence pseudo-randomly picks up ten sessions per set (20 sessions total). The “pseudo-randomly” means as long as the tag/selector and the size of the population remain unchanged, the same sample will be selected each time; if new sessions are added to ‘a' or ‘b', the sessions selected will change, even if the same selector is specified. This prevents the intrusion of human bias in the selection process.
Point 2: What is "kpi" and where to find the path?
Regression Intelligence monitors the value set in the "kpi" parameter to determine the regression status. Finding the “kpi” path value is tricky. You should generate a dummy report with limit = 1 and determine the path value to the target KPI. Refer to the JSON output in Step 7 to locate the path.
Point 3: What is the syntax to select ‘a’ and ‘b’ sessions?
Regression detection begins by extracting two groups from the collected sessions, so-called ‘a’ and ‘b’ (e.g. “build: 3.0” vs “build: 4.0”). Either tags or selectors can be used to extract sessions. In general, you prefer tags, which do not require special knowledge. However, selectors can be very useful for making complex selections that require logical or regular expressions or selector functions. See below for some useful expressions and examples.
Table: “HeadSpin Selector Syntax” table
7. The regression report is returned in JSON format that looks like the below. Note that it contains “Count” and “Sessions” in the “battery_current” category section. You can set regression alerts on them. In the following, we will set alerts on the “Duration” value.
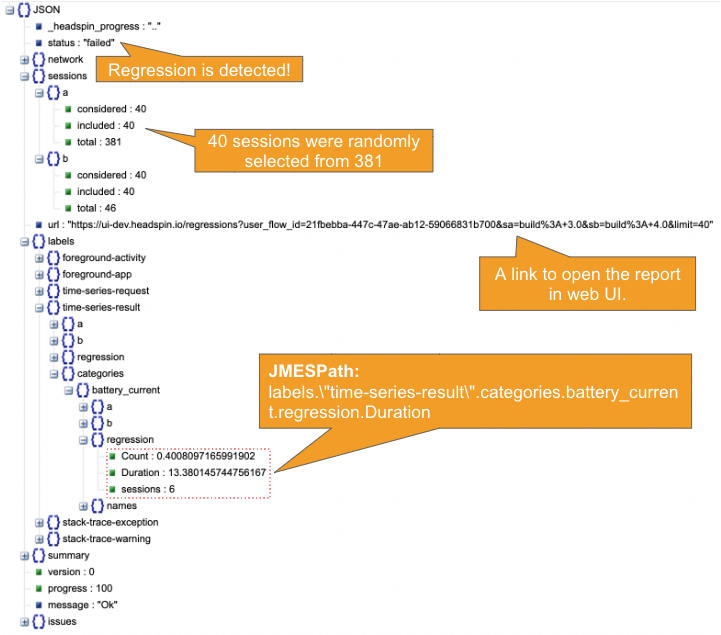
8. Find the report link in the result and open it to view the report in Web UI. On the right side of the image, the source of the "unacceptable battery usage" label is highlighted.
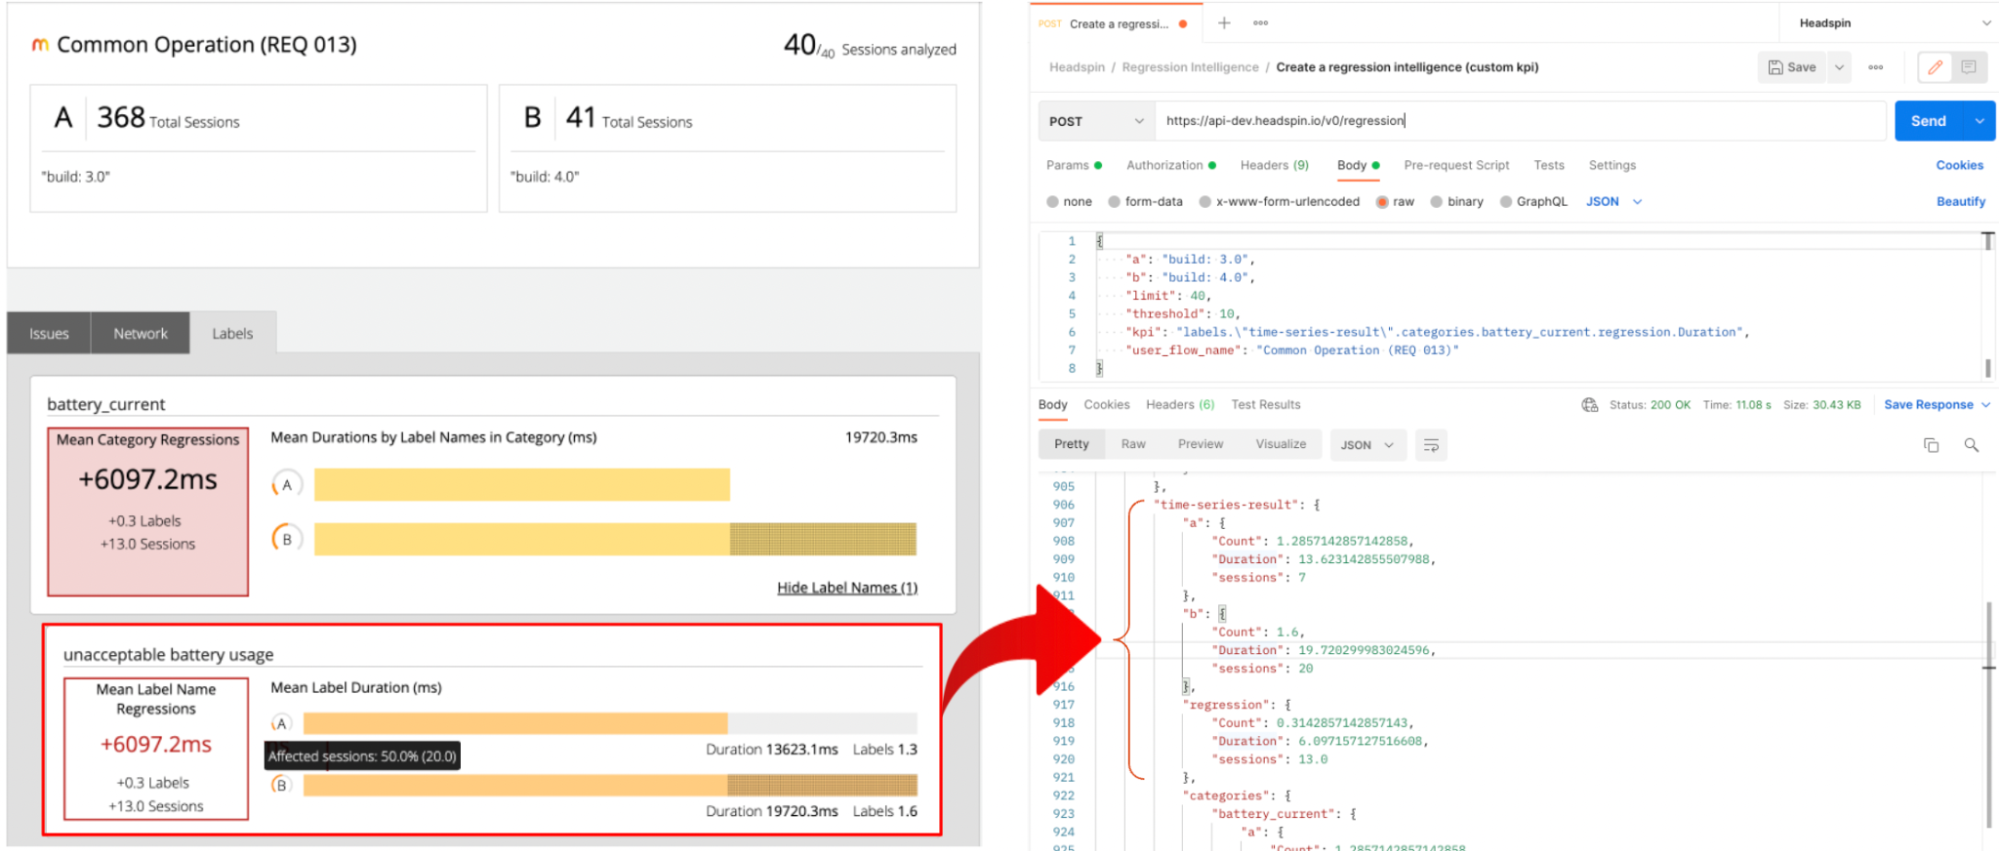
9. Let's pause for a moment and understand the report together.
- For each of 'a' and 'b', the duration of the “battery unacceptable usage” labels for 40 pseudo-randomly selected sessions are aggregated, and the mean value is calculated.
- The mean value of ‘a’ and ‘b’ (13623ms vs 19720ms) are compared, and the difference of 6097.2ms is computed.
- Since the value of ‘b’ (19.7s) exceeds 14.96s, which is 10% of ‘a’ (13.6s), the “status” shows “failed”, meaning regression has occurred.
- This means that the battery usage for the new build can be considered significantly worse than the old build. To confirm regression, you might inspect the KPI distribution chart (see Step 3). If no clue is found, it could be a coincidence or irregular. Since a significance level of 5% is often used in statistics, you might ignore it and monitor the situation until enough alerts are detected and a significant difference is confirmed. You may also increase the "limit" parameter or review population size to improve your confidence level. This topic will be discussed in more detail in Part 2.
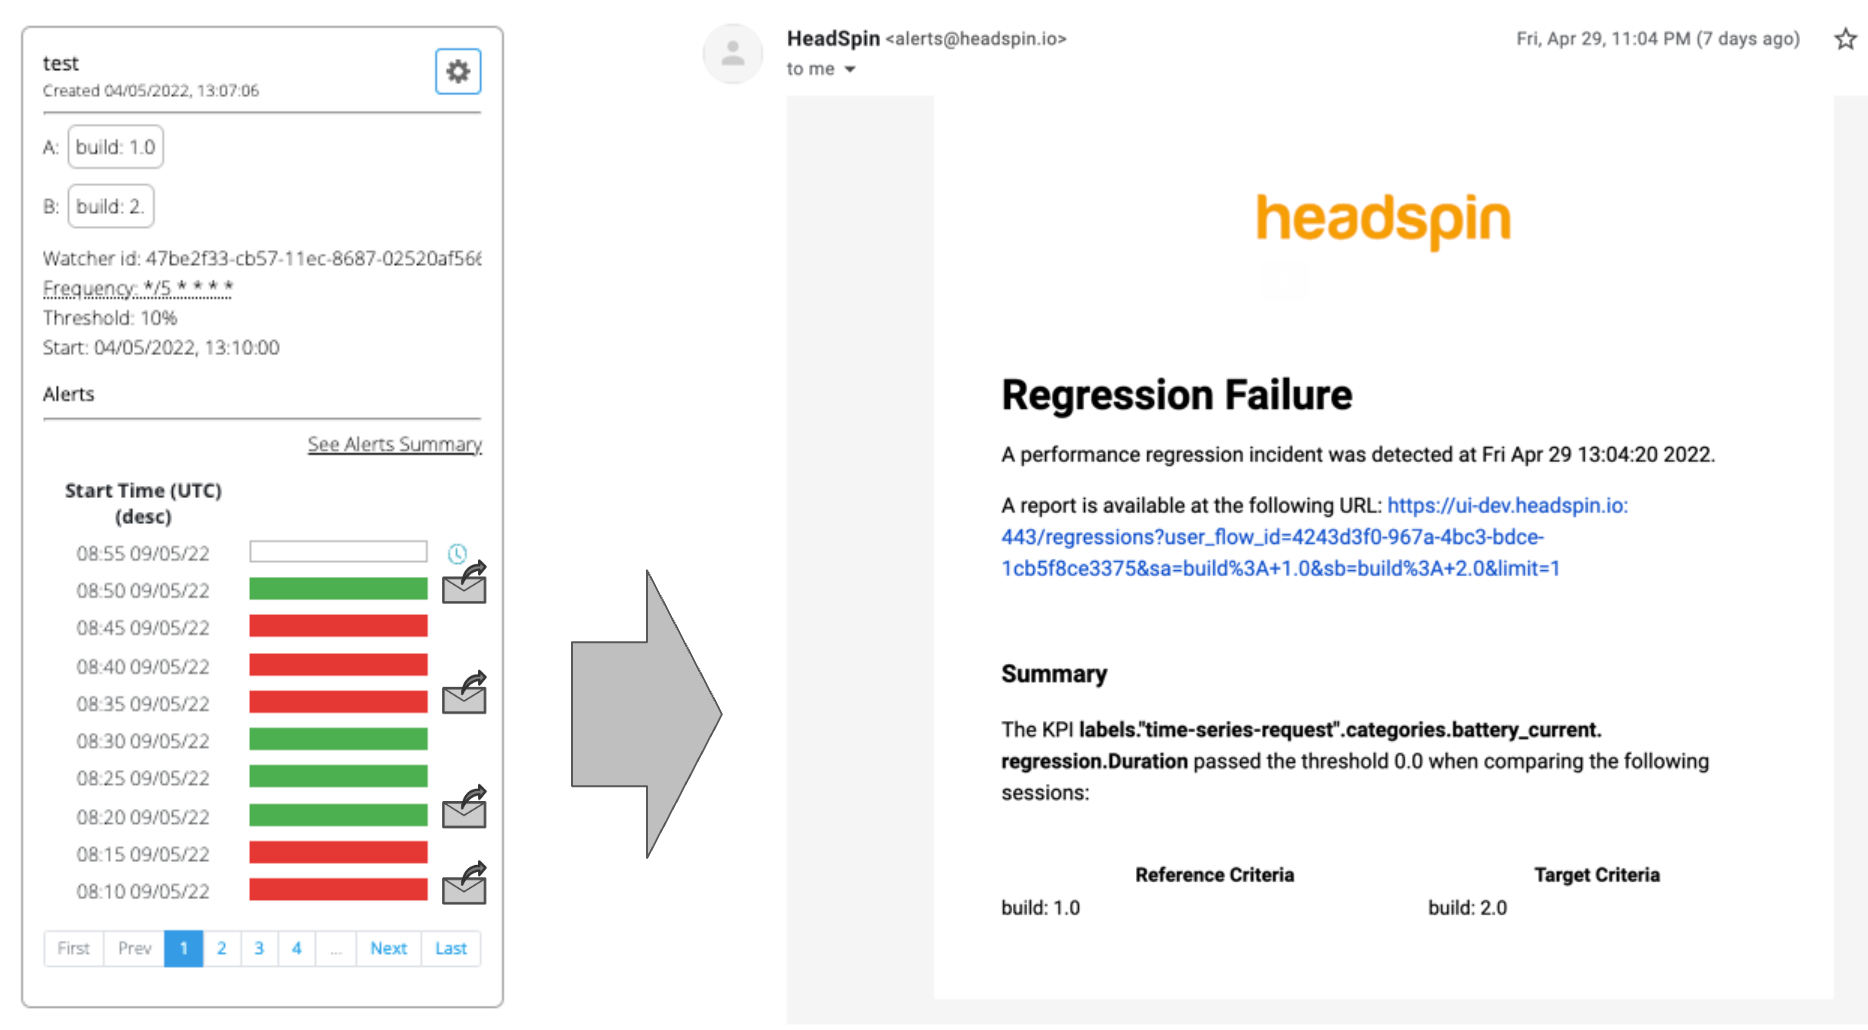
10. Create Watchers using Alert API. The watcher continuously monitors the reports for you and alerts you when regression occurs.
Set a pro-active performance regression monitoring agent via API
Note that HeadSpin allows you to create alerts in Web UI but there is no field to specify the "kpi" value, we need to use API here. If your target KPI is the default one, meaning “Network Latency”, use Web UI as shown below.

In the examples above, I used the cron expression “*/10 * * * *”, which means that the regression monitoring should be performed every 10 minutes. See the table below for various frequency settings.
Table: cron expression commonly used
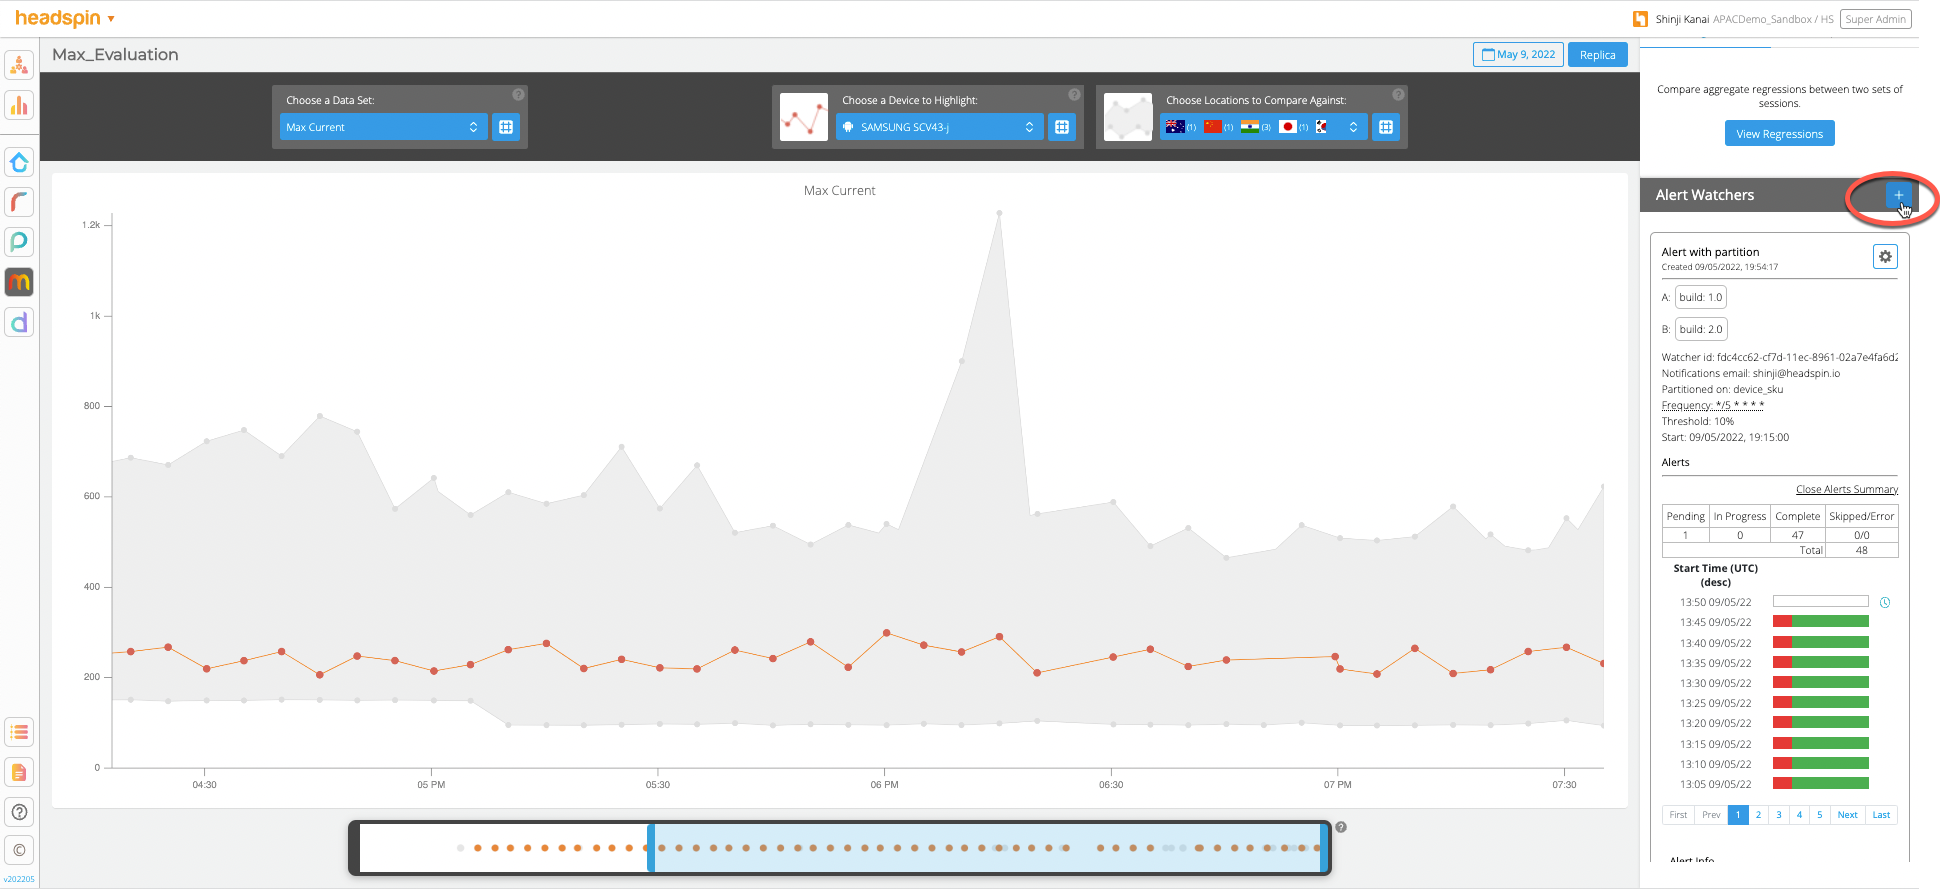
11. Let’s test if the regression monitoring and alerting are working as expected. When a report runs, the result will be displayed in three different colours: Green (success), Red (failure), and Yellow (skip, e.g. due to not enough samples). When a regression is detected and resolved, you will receive a notification at the time indicated by the email icon.
Be mindful that the name and settings cannot be changed once an alert has been set up. Deleting an alert will result in deleting all associated alert history and reports, so be careful.
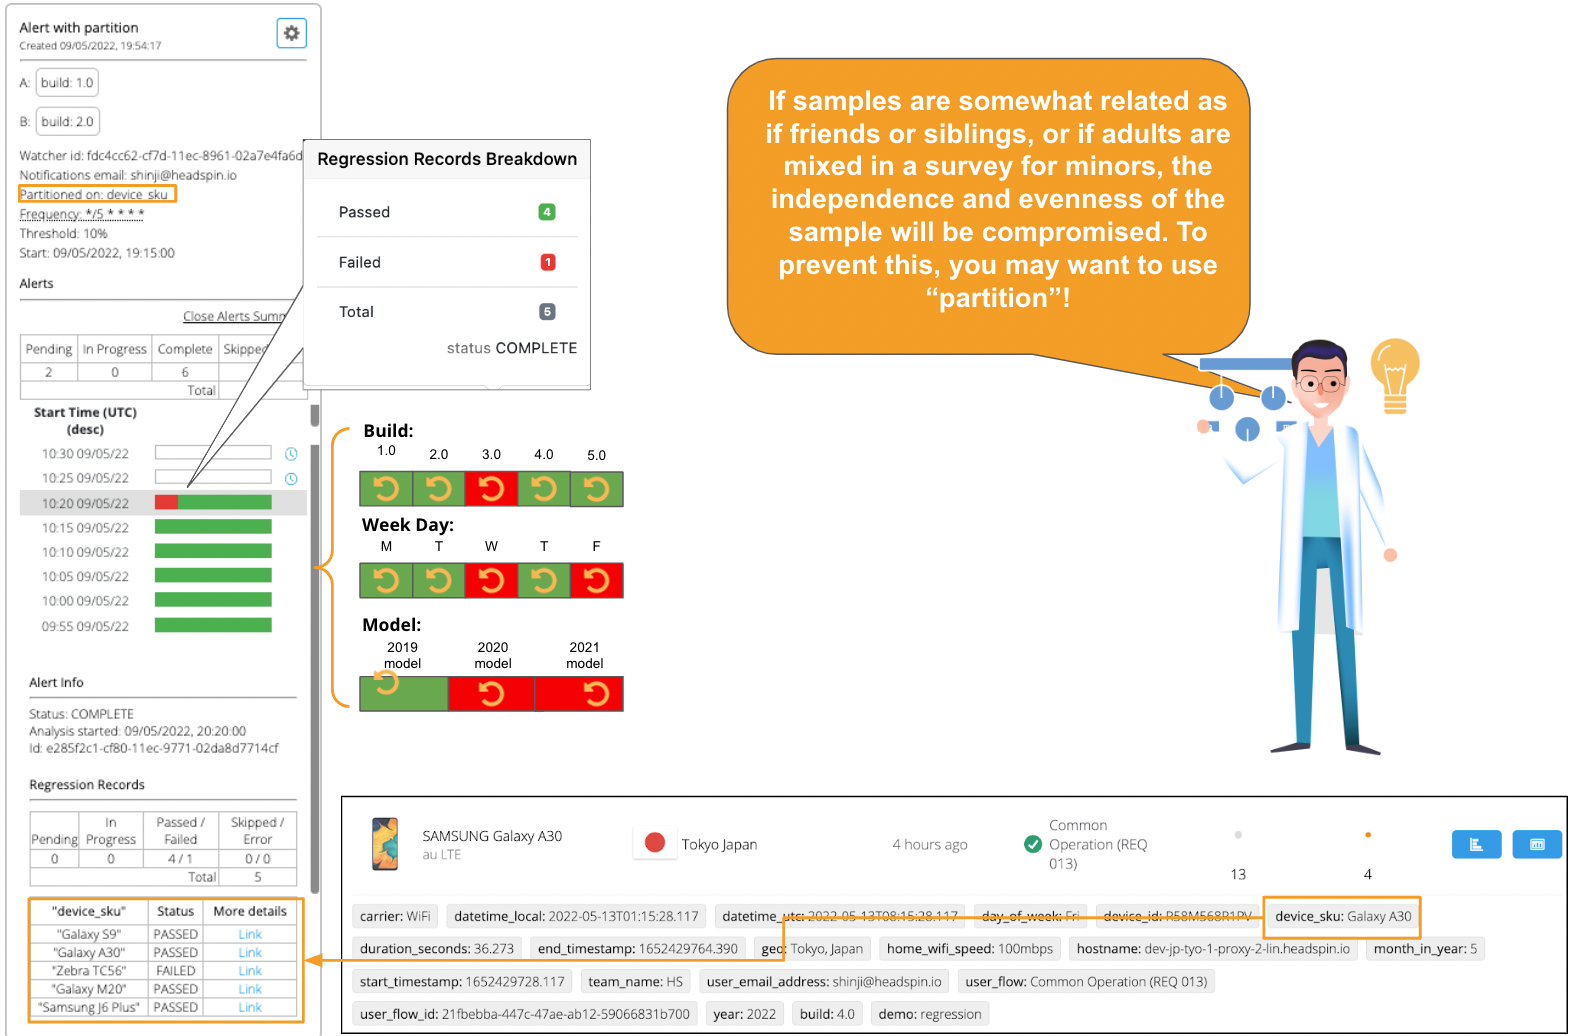
12. Optional: With the “partition” feature, you can set multiple regression alerts in a single setting. In the following example, see the “device_sku” tag is set to partition. The “device_sku” tag contains five values, each representing a particular device manufacturer, including Galaxy S9. Regression Intelligence monitors each device’s "unacceptable battery usage" KPI and issues an alert when a device exceeds the 10% threshold. You can set any user tags to the partition - not limited to “device_sku”. Very powerful, isn’t it? For more details, search “partition” on this product page.
Last, you might watch the following short videos to solidify your understanding of regression alerts.
Conclusion
Phew… Reading this far, I hope you understand how regression monitoring and alerting work. In this article, we focused on the confusing aspects of Regression Intelligence, including customer KPIs, when and how to use Grafana and Watcher, interpret regression reports, and set up alerts in a practical manner. All the essential materials and references are in one place, so bookmark this page and use it as a handbook or share it with your team members to expedite knowledge sharing. In Part 2, we will look into more advanced topics, including network latency and aggregation, percentile, percentile rank and more. Understanding these concepts will help you solve regression problems in wider situations. See you next time!


-1280X720-Final-2.jpg)


