


.png)


.png)


AI-Powered Key Takeaways


Debugging a webpage on a desktop is easy. On an iPhone, it is a different story. There is no built-in Inspect Element button in mobile Safari like the one many developers are used to in desktop browsers. That is why teams often get stuck when a layout breaks on iOS, a tap target does not respond, or a script behaves differently on mobile Safari.
The good news is that inspecting elements on an iPhone is absolutely possible. The most reliable method is Safari's Web Inspector on a Mac, Apple’s official workflow for inspecting and debugging web content on iPhone. If you do not have a Mac, there are still workable alternatives for lightweight inspection and debugging, including browser-based tools and cloud testing platforms.
Can You Inspect Element on iPhone?
Yes, you can inspect elements on an iPhone. But not in the same direct way you would on a desktop browser.
For full inspection of HTML, CSS, JavaScript, console activity, and network behavior on iPhone Safari, the standard method is to enable Web Inspector on the iPhone and connect it to Safari on a Mac. Apple documents this workflow through Safari Developer Tools.
If you do not have a Mac, you can still use limited alternatives such as JavaScript bookmarklets, in-browser debugging tools, or cloud testing platforms that expose remote inspection workflows.
Also Read our related guide - How to Inspect Element on an Android Device
Method 1: Inspect Element Using Safari Developer Tools (Mac Required)
This is the most reliable and complete way to inspect a webpage on an iPhone.
What you need
- An iPhone
- A Mac
- Safari on both devices
- A cable or trusted connection between the iPhone and Mac
- Web Inspector enabled on the iPhone
- The Develop menu enabled in Safari on the Mac
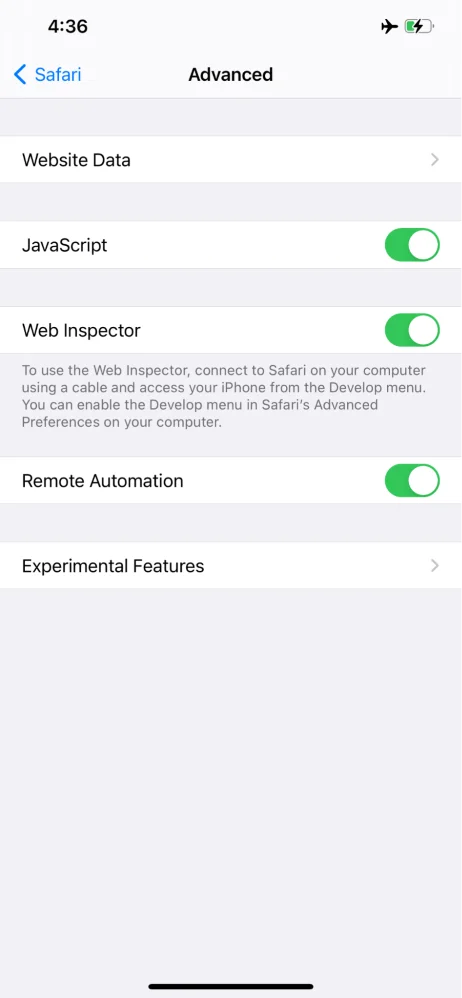
Step 1: Enable Web Inspector on iPhone
On your iPhone:
- Open Settings
- Go to Apps
- Tap Safari
- Scroll to Advanced
- Turn on Web Inspector
Step 2: Enable the Develop menu in Safari on Mac
On your Mac:
- Open Safari
- Go to Safari > Settings or Preferences
- Open the Advanced tab
- Enable Show Develop menu in menu bar
Step 3: Open the website on your iPhone
Launch Safari on the iPhone and open the webpage you want to inspect.
Step 4: Connect the iPhone to your Mac

Connect the device and make sure the iPhone is unlocked and trusted by the Mac. Once the connection is active, Safari on the Mac can detect the page opened on the iPhone. Apple’s tooling is designed for inspecting web content running on iOS devices from a connected Mac.
Step 5: Open Web Inspector from the Develop menu
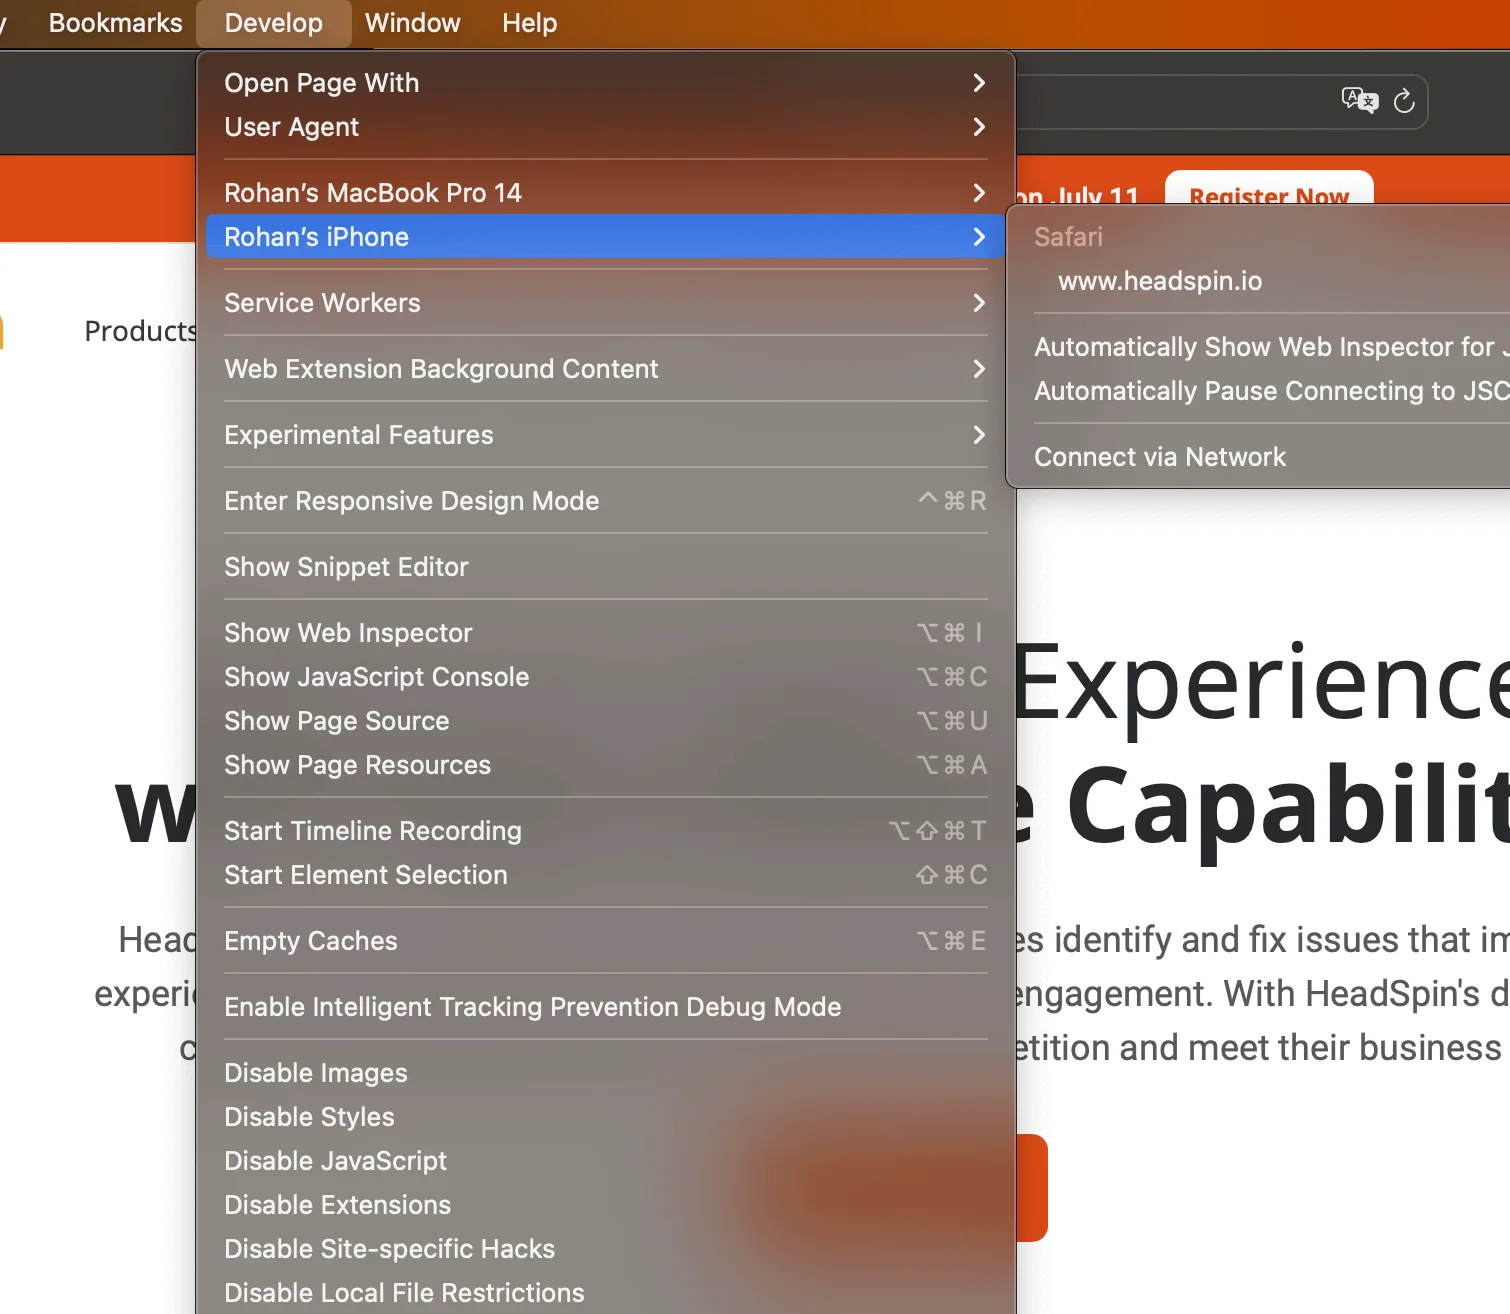
On your Mac:
- In Safari, click Develop
- Find your iPhone in the menu
- Select the active webpage
- Safari Web Inspector will open for that mobile page
What you can do with Safari Web Inspector
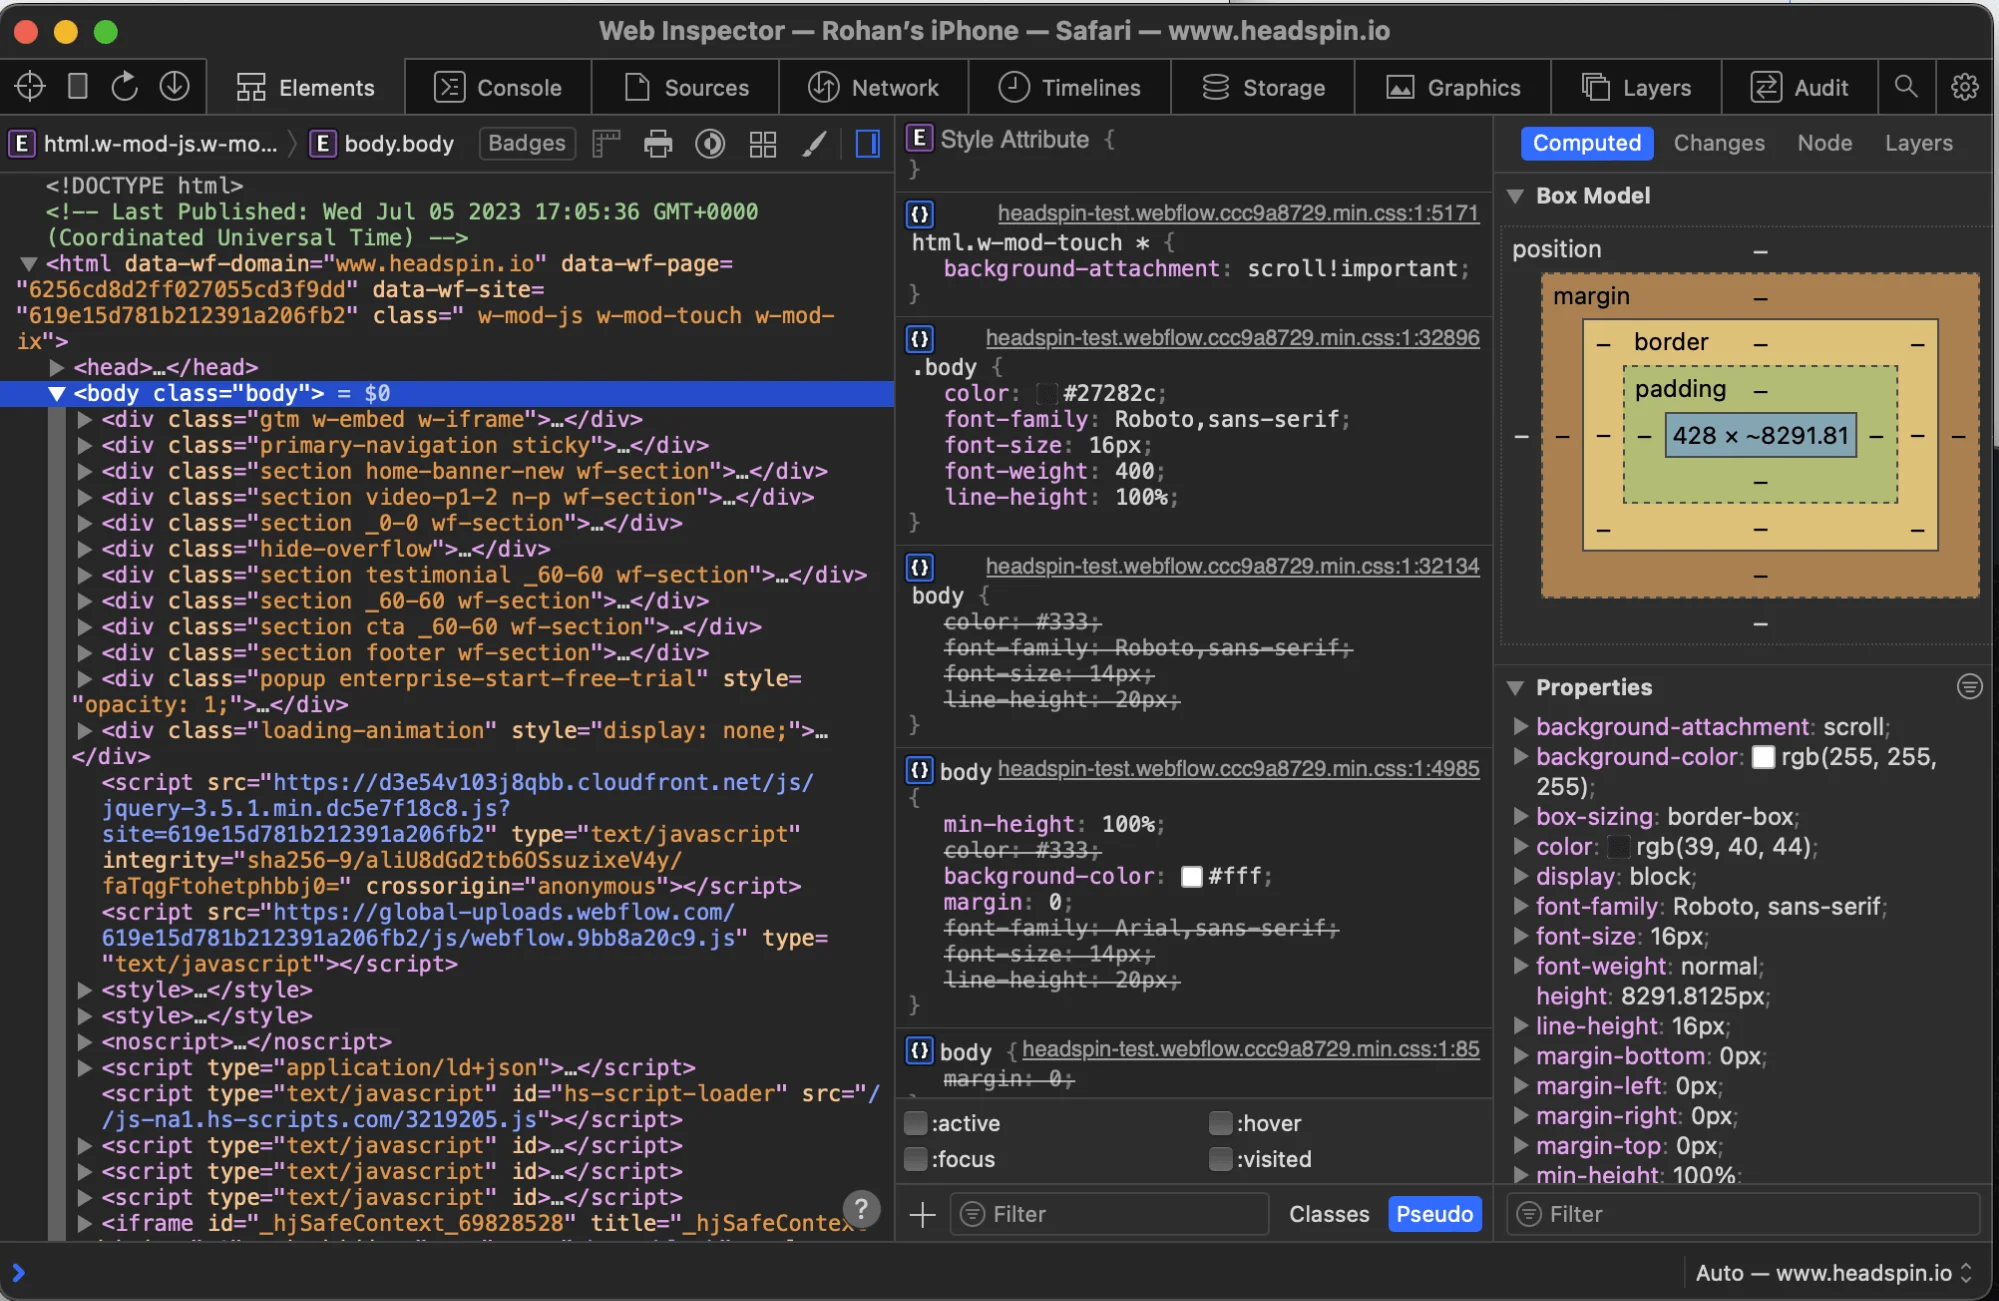
Once connected, you can:
- Inspect and edit HTML
- View and test CSS rules
- Debug JavaScript
- Use the console
- Review network activity and page resources
This is the best option when accuracy matters, especially for mobile Safari-specific issues.
If you want to inspect and debug websites directly on your desktop, you can also explore how to use Inspect Element on Mac for a faster and more flexible workflow.
Method 2: How to Inspect Element on iPhone Without Mac
If you do not have a Mac, you still have a few practical options. Just keep your expectations realistic. These methods are helpful for quick checks, but they usually do not offer the same depth as Safari Web Inspector.
Option 1: Use a JavaScript bookmarklet
Some tools let you save a JavaScript snippet as a bookmark in Safari. When tapped on a webpage, it injects a lightweight inspection overlay into the page.
This can help with:
- Viewing page structure
- Checking basic styles
- Running simple debugging actions
But it has limits:
- It is not native Safari Web Inspector
- It may not work well on all sites
- It is not ideal for deeper network or performance debugging
Option 2: Use Eruda for lightweight mobile debugging
Eruda is an open-source console for mobile browsers. It can be injected into a page and gives you access to a compact developer panel on mobile, including console and inspection-style utilities.
This is useful when you need a fast on-device debugging view for:
- Console logs
- DOM exploration
- Basic script testing
Still, it is better treated as a lightweight workaround than a full inspection environment.
Option 3: Use third-party browser apps with developer utilities
Some iPhone apps provide in-app browser debugging features. These can be helpful for quick HTML or JavaScript checks, but reliability and depth vary by app. They are best for simple troubleshooting, not for serious debugging of production issues.
For a more advanced and reliable setup, you can also check out our Chrome remote debugging guide to inspect and debug mobile websites using desktop tools.
Method 3: Using Cloud Testing Platforms
Cloud testing platforms make element inspection easier by providing real device access without requiring teams to manage hardware locally.
This is the easiest route for distributed teams. The real advantage is not just convenience. It is access to real iPhones, shared testing workflows, and remote debugging support from anywhere.
Where HeadSpin fits in
HeadSpin gives teams access to real devices in the cloud and supports remote debugging workflows for iOS devices. HeadSpin enables remote debugging on iOS devices and local connection workflows for iOS devices in its platform tutorials. Its real-device cloud is designed to identify issues that may not appear in simulated environments.
Typical workflow on a cloud platform
- Log in to the platform
- Start a real iPhone session
- Open the site or web app
- Launch the available inspection or remote debug workflow
- Review DOM, styles, logs, and behavior based on the platform’s supported tooling
Why this method matters
This approach is especially useful when:
- Your team does not use Macs
- You need access to multiple iPhone models
- You want to inspect on real devices, not just emulators
- You need to collaborate across QA and development teams
Why You Can’t Inspect Element Directly on iPhone
The reason is simple. iPhone Safari does not expose a desktop-style developer tools panel directly inside the browser.
Apple’s official workflow is built around enabling Web Inspector on the iPhone and then using Safari on a Mac to inspect that web content. In other words, the iPhone can be inspected, but the actual inspector interface lives on the Mac.
That design is why developers looking for a long-press Inspect option on iPhone never find one.
Best Methods to Inspect Element on iPhone (Comparison Table)
This is the practical takeaway: if you need full debugging, use Safari Web Inspector. If you need convenience, use a cloud platform. If you just need a quick peek, lightweight on-device tools can help.
Common Issues and Fixes (Troubleshooting Guide)
1. Your iPhone does not appear in the Develop menu
Possible fix: Make sure Web Inspector is enabled on the iPhone and the Develop menu is enabled in Safari on the Mac. Also confirm the device is unlocked and trusted.
2. The page opens, but Web Inspector shows nothing
Possible fix: Reload the page on the iPhone after connecting. Also, make sure you selected the correct active tab under the device in Safari’s Develop menu. Apple’s inspection workflow depends on selecting the active webpage from the connected device.
3. You can inspect the page, but changes do not stick
Why it happens: Inspect Element edits are temporary. They help you test or debug locally, but they do not permanently change the live website unless you update the actual source code. This is standard developer-tools behavior.
4. A bookmarklet or lightweight tool is not working on a site
Possible fix: Some pages restrict script behavior, use strict policies, or load content dynamically in ways that break lightweight inspection tools. In these cases, Safari Web Inspector or a cloud-based debugging workflow is usually more reliable.
5. You are debugging a hybrid or app-based experience, not just Safari
Possible fix: For mobile app UI inspection, especially native or hybrid app elements, Appium Inspector may be more useful than a browser-only approach. Appium’s ecosystem supports automation across iOS and other mobile platforms, and HeadSpin also has content around locator inspection for mobile web and hybrid apps.
Why Developers Need Inspect Element on iPhone
Desktop rendering is not enough. A page that looks perfect in Chrome on a laptop can still break on iPhone Safari.
Developers and QA teams use inspection on iPhone to:
- Debug layout shifts on small screens
- Check CSS behavior in mobile Safari
- Find broken buttons, menus, and forms
- Troubleshoot JavaScript issues that happen only on iOS
- Validate responsive design and mobile web experiences
That matters because Safari Web Inspector is built specifically to inspect and debug web content running on iOS devices. When the issue only happens on iPhone, debugging on iPhone is the only honest way to see it clearly.
Pro Tips for Faster Debugging on iPhone
1. Use a real device when the bug is device-specific
Simulators are helpful, but real-device testing is often better for catching actual rendering and behavior issues. HeadSpin’s real device cloud is built around this exact point: issues can appear on real devices that do not show up in simulated environments.
2. Check console errors early
A lot of iPhone-specific issues are really JavaScript or resource-loading problems. The console often tells you more, faster, than the DOM panel alone. Safari Web Inspector includes console access as part of its developer tooling.
3. Do not rely only on visual checks
Inspecting elements is not just about seeing broken UI. It is about checking the underlying HTML, CSS, scripts, and resources to find the actual cause.
4. Keep a simple fallback path
For teams without Macs, use a cloud platform or a lightweight on-device tool for first-level checks, then move to full Safari Web Inspector when the issue needs deeper analysis.
How HeadSpin Simplifies iPhone Element Inspection
HeadSpin helps by making iPhone debugging more practical for teams that need real-device access, distributed workflows, and remote testing support.
Here is what that really means in practice:
- Real iPhone access in the cloud: You can test on real devices rather than relying only on local hardware or simulated environments. HeadSpin’s real-device cloud helps identify issues that simulated environments can miss.
- Remote debugging support for iOS devices: HeadSpin enables remote debugging workflows for iOS devices, which is useful when teams need to inspect and troubleshoot without always manually setting up local devices.
- Useful for mobile web, hybrid, and broader test workflows: HeadSpin also has guidance around determining element locators for mobile web and hybrid apps, which is relevant when inspection is part of building or stabilizing automation.
For teams debugging mobile web issues at scale, that combination is often more practical than piecing together one-off local setups.
Conclusion
Inspecting elements on an iPhone is not impossible. It just works differently from a desktop.
If you want the most complete and reliable method, use Safari Web Inspector with a Mac. That is still the official and strongest workflow. If you do not have a Mac, lightweight tools like bookmarklets or Eruda can help with quick checks, while cloud testing platforms are a better fit for teams that need remote access and real-device coverage.
The real goal is not just to “inspect elements.” It is to debug what your users actually experience on the iPhone. That is where the right method and the right platform make all the difference.
FAQs
Q1. Can I inspect an element directly on an iPhone without a Mac?
Ans: Yes, but only through limited options such as bookmarklets, lightweight mobile debugging tools, or third-party apps. For full inspection in Safari, Apple’s standard workflow still requires a Mac.
Q2. What is the best way to inspect elements on an iPhone?
Ans: Safari Web Inspector with a Mac is the best option for full DOM, CSS, JavaScript, and console debugging on iPhone Safari.
Q3. Is Inspect Element on iPhone the same as the desktop browser inspect tools?
Ans: Not exactly. The purpose is similar, but the workflow is different. On iPhone, the inspector interface is typically accessed from Safari on a Mac rather than directly inside the mobile browser.
Q4. Can I use Inspect Element on iPhone for live site changes?
Ans: You can make temporary edits while debugging, but those changes are local and do not permanently alter the live website.
Q5. What if I need to inspect app elements, not just a webpage?
Ans: For native or hybrid app UI inspection, tools like Appium Inspector are often more appropriate than browser-only inspection methods. Appium supports mobile automation across iOS and other platforms.


-1280X720-Final-2.jpg)


