


.png)


.png)


AI-Powered Key Takeaways


Introduction
Understanding app performance is crucial for delivering a seamless user experience. HeadSpin session reporting provides a comprehensive analysis of user interactions, crashes, latency, and other essential metrics, aiding in optimizing app experiences. One powerful feature of HeadSpin is the ability to label time series KPIs during a session.
In this tutorial, we will explore how to use HeadSpin labeling capabilities through its Timeseries API to mark regions of interest based on specific KPI thresholds within a session.
The Power of HeadSpin Session Reporting
HeadSpin session reporting offers a detailed view of user interactions within mobile applications, providing invaluable insights into app performance. By capturing and analyzing key metrics, such as Net CPU usage, memory utilization, and battery drain, these reports empower developers and stakeholders to make data-driven decisions to enhance app functionality and user satisfaction.
One unique aspect of HeadSpin's reporting capabilities is the ability to set thresholds and create labels on device KPIs using the captured time series data. This lets users focus on specific session areas, facilitating a deeper understanding of app behavior under various conditions.
Key Terms: Understanding Sessions, Labels, and Time Series Data
Before delving into the tutorial, let's familiarize ourselves with some essential terms related to HeadSpin session reports and HeadSpin labeling capabilities:
- Sessions: Sessions refer to reports encompassing highly detailed analytics and Key Performance Indicators (KPIs) captured using a session capture tool seamlessly embedded into our user interface.
- Labels: HeadSpin provides a sophisticated labeling system enabling users to mark specific regions within a session. This feature proves invaluable when focusing on particular areas of interest during analysis.
- Time Series Data: In the context of HeadSpin, time series data signifies the captured device metrics such as Net CPU usage, memory utilization, battery drain, and more. Analyzing these metrics over time provides crucial insights into app performance and behavior.
Now that we have a foundational understanding of these terms, let's explore how HeadSpin labeling capabilities can be harnessed effectively using the Timeseries API to mark key regions based on specific KPI thresholds within a session.
Read: 8 Critical KPIs that affect user experience in the mobile games
Prerequisites: Setting Up the Session and KPI Labeling
Before we explore HeadSpin labeling capabilities and use the Timeseries API effectively, setting up the necessary prerequisites is essential. Here's a step-by-step guide to get started:
1. Creating a Session: We must create a session to begin the analysis. This can be achieved through the following methods:
- If performing a manual test session, use the capture button provided in the UI.
● For automated sessions:
- Add the capability "headspin:capture": "true" in your Appium script.
- Alternatively, use the curl command:
2. Accessing the Report: Once the session is created, you will receive a report, which can be accessed in the "Performance Sessions" tab.

Also read: Exploring performance testing tools in the software industry
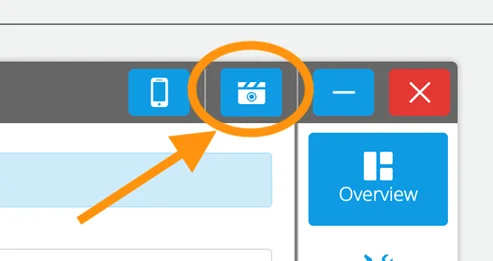
3. Accessing the Session for Labeling: Go to the "P" tab and open the specific session you intend to label.
Labeling for Time Series KPIs with HeadSpin
1. Using the API via the UI: To begin labeling using the Timeseries API within the UI, follow these steps:
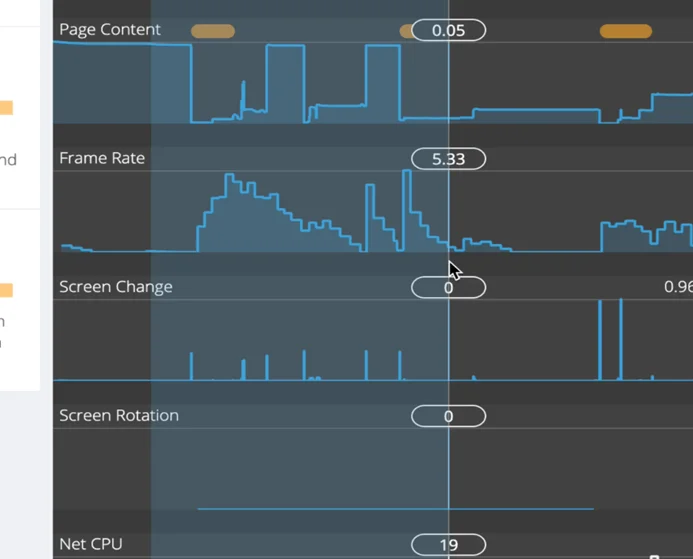
- Choose the time-series KPI you want to label for the session. Remember to modify the KPI name to lowercase and replace spaces with underscores (e.g., "Net CPU" becomes "net_cpu").
- Use the API by selecting the region of interest within the session. You can achieve this by clicking on the starting point and dragging to the desired region.
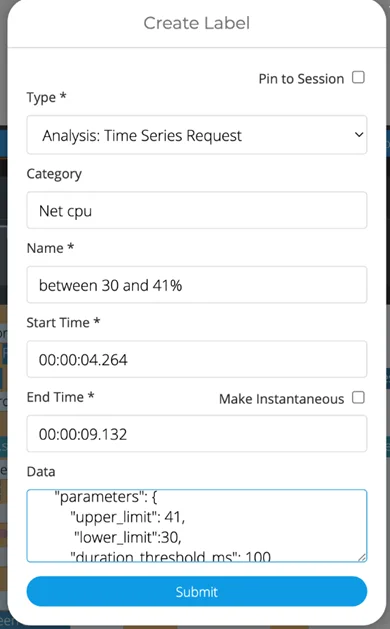
- Once the region is selected, a pop-up will appear. Choose "Type" as "Analysis: Time Series Request," and enter the "Category" and "Name."
- Now, you can add parameters to mark the KPIs. The parameters are defined using a JSON-like format.
2. Generating Labels using the "Range" Method: The "Range" method allows you to mark specific regions of the time-series KPI by setting parameters like upper and lower limits. Here are the parameters to utilize:
● List of parameters:
- "lower_limit": Sets the lower limit for the range.
- "upper_limit": Sets the upper limit for the range.
- "include_lower_limit": Set to true to include the lower limit in the range.
- "include_upper_limit": Set to false to exclude the upper limit in the range.
- "duration_threshold_ms": If the duration of the identified time interval (that meets the range condition) is less than this threshold, the time interval is discarded.
- "merge_threshold_ms": After applying the "duration_threshold_ms", this threshold is applied. If the gaps between any consecutive time intervals are equal to or less than this threshold, the consecutive time intervals are merged into one.
● Example:
If you wish to mark regions with Net CPU between 30 - 41% values, you can set the lower limit to 30 and the upper limit to 41. The code to be entered in the data field will look like this:
Here, in the range selected, the API marks regions where the net CPU usage is above 30% and below 41%, and any region that has this value for less than 100ms will be discarded. The result will be as shown in the screenshot below:
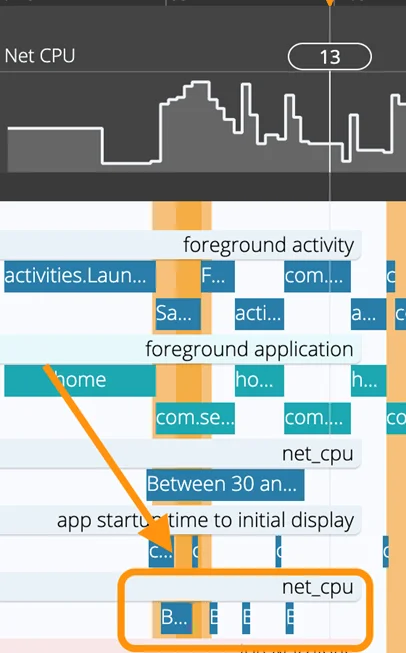
The above picture shows the Net CPU time-series KPI on the top, and the labels are created at the bottom.
Wrapping Up
HeadSpin's session reporting and labeling capabilities empower users to gain deep insights into app performance by analyzing time series KPIs. By leveraging the Timeseries API and techniques like the "Range" method, developers and stakeholders can efficiently mark regions of interest based on specific KPI thresholds. This enhances their ability to optimize app functionality and deliver exceptional user experiences.
Explore the potential of HeadSpin's labeling features and unlock a new level of app performance analysis.
FAQs
Q1. How does HeadSpin's labeling system enhance session analysis?
Ans: HeadSpin's labeling system allows users to mark specific regions within a session, visually representing crucial events or areas of interest. By categorizing and labeling portions of the session data, users can easily navigate and focus on the aspects that require attention, making session analysis more efficient and insightful.
Q2. Can HeadSpin's session reporting be customized to suit specific project requirements?
Ans: Yes, HeadSpin offers customizable session reporting. Users can tailor the parameters and metrics they want to analyze in a session, allowing for a personalized approach based on the project's unique requirements. This customization ensures that users can extract the most relevant insights and align the analysis with the specific goals of their app or software development projects.


-1280X720-Final-2.jpg)


