


.png)


.png)


AI-Powered Key Takeaways


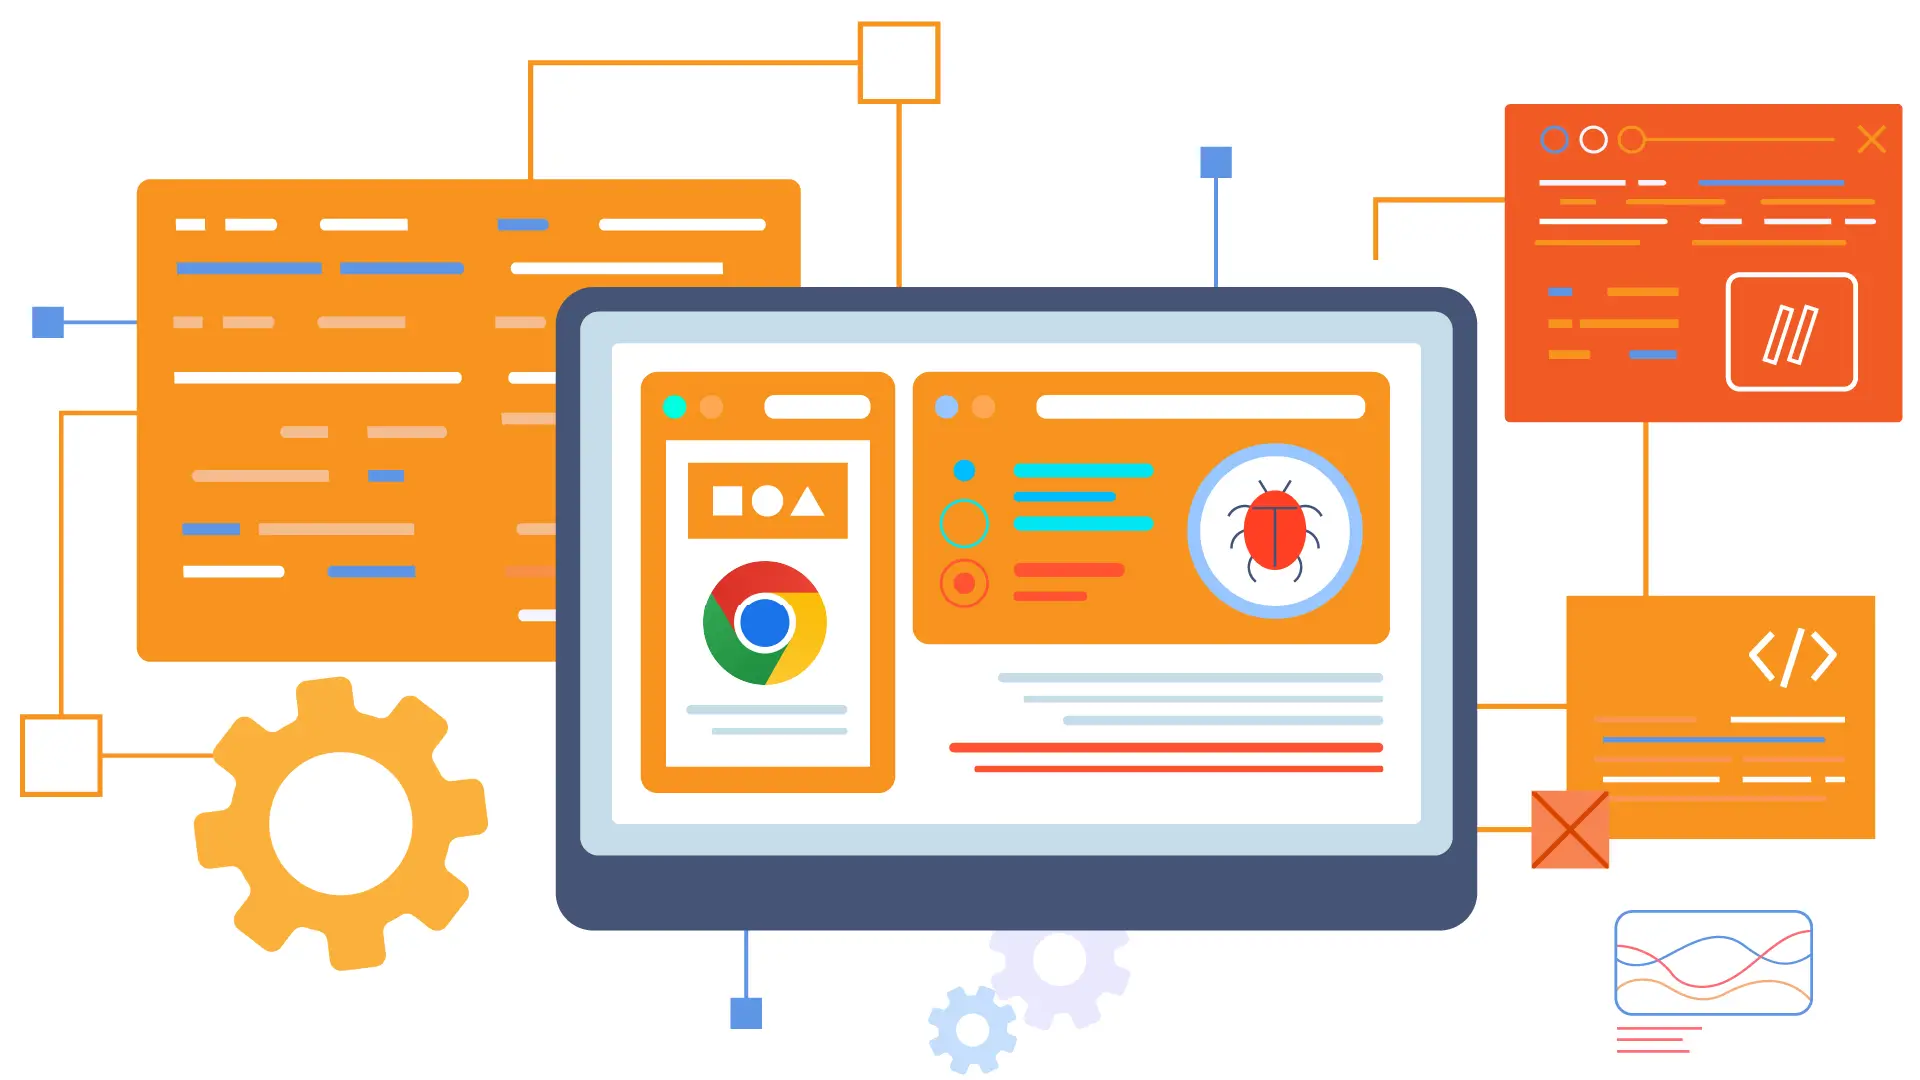
Debugging is a daunting task when working in remote environments. But fear not! Chrome remote debugging is here to save the day. This powerful feature lets you debug your web applications on a remote device using Google Chrome DevTools. In this guide, we’ll delve into the nitty-gritty of Chrome remote debugging, providing you with all the information you need to become a pro. Plus, we'll explore how HeadSpin can make your life easier by facilitating testing on a real device cloud.
What is Chrome Remote Debugging?
Chrome remote debugging is a powerful feature provided by Google Chrome that allows developers to debug web pages and web applications running on remote devices. This capability is particularly beneficial when users access the web from various devices with varying screen sizes, operating systems, and browser versions. By enabling remote debugging, developers can ensure that their applications perform optimally across different environments without possessing every device physically.
Here’s a closer look at the key components and advantages of Chrome remote debugging:
Key Components
Chrome DevTools
The cornerstone of Chrome remote debugging is the Chrome Developer Tools (DevTools), an integrated web development and debugging tool suite. DevTools includes features like the Elements panel for inspecting HTML and CSS, the Console for running JavaScript, the Network panel for analyzing network activity, and the Sources panel for setting breakpoints and debugging JavaScript code.
Remote Target Device
The target device is the remote device you want to debug. This could be an Android smartphone, tablet, or another computer. The target device runs the web page or application you wish to debug.
Communication Channel
Remote debugging relies on a communication channel between your local development machine and the target device. This is typically established via USB for Android devices but can also be done over a network connection.
Advantages
Cross-Device Debugging
Chrome remote debugging allows developers to test and debug their applications on various devices without interacting with each one physically. This is essential for ensuring a consistent user experience across different platforms.
Real-Time Inspection
In real-time, developers can inspect and modify the DOM, CSS, and JavaScript. This immediate feedback loop helps quickly identify and fix issues that may not be apparent in a traditional desktop development environment.
Performance Analysis
Using DevTools, developers can analyze network activity, identify performance bottlenecks, and monitor resource usage on the target device. This is crucial for optimizing the performance of web applications, especially on mobile devices with limited resources.
Enhanced Debugging Capabilities
Features like setting breakpoints, stepping through code, and profiling JavaScript execution provide deep insights into the behavior of web applications. These tools help developers understand and resolve complex issues more efficiently.
Setting Up Chrome Remote Debugging
Getting started with Chrome remote debugging involves a few straightforward steps. Here’s how you can set it up:
Enable Remote Debugging on Your Device:
- Enable USB debugging by accessing developer options for Android devices.
- Connect the Android device you have to a computer via USB.
Launch Chrome with Remote Debugging:
- Open your terminal or command prompt.
- Run the following command:
chrome.exe --remote-debugging-port=9222
Connect to the Remote Device:
- Open Chrome on your desktop and navigate to chrome://inspect.
- Click the "Configure..." button and add the target device's IP address.
- You should now see the remote device listed. Click "Inspect" to start debugging.
Using Chrome DevTools for Remote Debugging
Once you’ve set up Chrome remote debugging, you can use Chrome DevTools to inspect and debug your web application. Chrome DevTools helps developers understand and optimize their web applications. Here’s a breakdown of the key features and how to use them effectively:
Elements Panel
Using the Elements panel, you can inspect and modify your web page's DOM (Document Object Model) and CSS in real-time. This is useful for making quick changes and seeing the results immediately. You can:
- Inspect Elements: Hover over any element on your web page to highlight it in the Elements panel. Click on the element to view its HTML and CSS.
- Edit HTML: Double-click on any HTML tag to edit it. This helps with testing changes without altering the actual codebase.
- Edit CSS: Modify CSS properties directly in the Styles pane. You can add, remove, or change properties to see how they affect the element's appearance.
Console Panel
The Console panel is your go-to place for executing JavaScript, logging messages, and monitoring the performance of your application. Here’s what you can do:
- Execute JavaScript: Run any JavaScript code directly in the console to test snippets or debug issues.
- Log Messages: Use console.log() to print messages and variables to the console, helping you understand the flow of your application.
- Monitor Errors: View any JavaScript errors or warnings on your web page. Clicking on an error will take you to the corresponding line of code.
Network Panel
The Network panel is essential for analyzing network requests and responses. This helps you identify performance bottlenecks. Key features include:
- View Network Requests: See a list of all network requests made by your web page, including XHR (XMLHttpRequest) and Fetch API calls.
- Analyze Performance: Check the timing of each request, such as DNS lookup, TCP handshake, and content download, to identify slow areas.
- Inspect Responses: Click on any request to view its headers, payload, and response. This is useful for debugging API calls and ensuring correct data is returned.
Sources Panel
The Sources panel is where you can debug your JavaScript code. It provides a comprehensive set of tools to help you find and fix issues:
- Set Breakpoints: Click on the line number in your JavaScript code to set breakpoints. This pauses the execution of your code at that line, allowing you to inspect variables and the call stack.
- Step Through Code: Use the step over, step into, and step out buttons to navigate your code line by line. This helps you understand the flow and identify where issues occur.
- Watch Expressions: Add variables or expressions to the Watch pane to monitor their values as you pass your code.
Application Panel
The Application panel provides insight into your web app’s storage, including cookies, local storage, session storage, and IndexedDB. Here’s what you can do:
- Manage Cookies: View, edit, and delete cookies used by your web application.
- Inspect Storage: Look at local storage, session storage, and IndexedDB data. This is useful for understanding how your app saves state and user data.
Read: A Comprehensive Guide to Cookie Management Using HeadSpin's Cutting-Edge Remote Control Interface
Best Practices for Chrome Remote Debugging
To make the most out of Chrome remote debugging, consider these best practices:
Use Stable Connections:
Ensure your network connection is stable to avoid disruptions during debugging sessions. A dropped connection can interrupt your workflow and cause a loss of valuable debugging progress.
Keep Chrome Updated:
Regularly update Chrome to benefit from new features and bug fixes. Chrome updates often include improvements to DevTools and the remote debugging protocol, which can enhance your debugging experience and fix known issues.
Secure Your Remote Debugging Setup:
Use secure methods to connect to remote devices, especially when debugging over the internet. This can include using VPNs, SSH tunnels, or other secure networking techniques to protect your data and prevent unauthorized access.
Document Your Debugging Process:
Keep detailed notes of your debugging steps and findings to facilitate collaboration and future reference. A shared document or a dedicated debugging log can help track issues, solutions, and insights, making it easier for team members to understand and build on each other's work.
Automate Repetitive Tasks:
Use automation tools to streamline repetitive debugging tasks. Tools like Puppeteer or Selenium can automate interactions with your web application, allowing you to focus on diagnosing and fixing issues.
Also read: Top tools and frameworks for automated Android app testing
Common Issues and Troubleshooting
Even with the best setup, you might encounter some issues. Here are common problems and how to troubleshoot them:
Device Not Detected:
- Check USB Debugging: Ensure USB debugging is enabled in your device's developer options.
- Verify Connection: Make sure the device is properly connected via USB.
- Restart Devices: A simple restart of your device and computer can resolve connectivity issues.
- Update Drivers: Ensure that your computer has the latest USB drivers installed for your device. This is particularly important for Windows users.
Connection Timeouts:
- Stable Network: Check that your network connection is stable. Unstable or slow networks can cause timeouts when connecting to remote devices.
- Firewall Settings: Ensure your firewall does not block the remote debugging port (usually 9222).
- IP Address Configuration: Double-check that you've entered the correct IP address of the remote device in Chrome's "Configure..." settings.
DevTools Not Loading:
- Clear Cache and Cookies: Sometimes, issues with loading DevTools can be resolved by clearing your browser's cache and cookies. Go to Chrome settings > Privacy and security > Clear browsing data.
- Incognito Mode: Try accessing DevTools in incognito mode to rule out any extensions or cached data causing the issue.
- Disable Extensions: Certain Chrome extensions can interfere with DevTools. Try disabling them to see if that resolves the issue.
Laggy Performance:
- Close Unnecessary Tabs: Running too many tabs can slow down your browser. Close unnecessary tabs to free up resources.
- Check Device Resources: Ensure that other processes do not overwhelm your debugging remote device. You can use the device's task manager or settings to check resource usage.
- Network Speed: Verify that your local and remote networks have sufficient bandwidth. Slow network speeds can cause lag in the DevTools interface.
How HeadSpin Enhances Browser Testing
HeadSpin offers a comprehensive platform that significantly enhances browser testing by allowing you to test on a real device cloud. Here's how HeadSpin can help:
- Access to Real Devices: Test your web apps on various real devices and browsers, ensuring compatibility and performance across different environments.
- Automated Testing: Utilize HeadSpin’s automated testing features to run extensive test suites without manual intervention.
- Detailed Analytics: Gain insights into performance metrics and identify issues quickly with HeadSpin's detailed analytics and reporting tools.
- Global Reach: Test your applications on devices worldwide to ensure they perform well in different locations.
Wrapping Up
Chrome remote debugging is an invaluable tool for modern web development, enabling developers to debug and test web applications across various devices and environments. Following this guide, you should understand how to set up and use Chrome remote debugging effectively. Additionally, leveraging platforms like HeadSpin can further enhance your testing process by providing access to a real device cloud and comprehensive testing tools.
FAQs
Q1. What is Chrome remote debugging?
Ans: Chrome remote debugging allows developers to debug web applications on remote devices using Chrome DevTools, making testing easier across different environments.
Q2. How do I secure my remote debugging sessions?
Ans: Use secure connections such as VPNs to prevent unauthorized access and ensure the remote debugging port is not exposed to the public internet.
Q3. What are some alternatives to Chrome remote debugging?
Ans: Alternatives include using Firefox’s Remote Debugging tools or Safari’s Web Inspector for iOS devices. Additionally, cloud testing platforms like HeadSpin provide robust remote debugging solutions.


-1280X720-Final-2.jpg)


