


.png)


.png)


AI-Powered Key Takeaways


Chrome DevTools, often called the "Swiss army knife" for web developers and testers, is a set of powerful Chrome debugging tools built into the Google Chrome browser. These tools let you inspect, debug, and optimize web applications. Whether you're a seasoned developer or just getting started with web testing, Chrome DevTools provides essential functionality to help you identify and fix issues quickly. This blog is a comprehensive guide on using Chrome DevTools that you can use. It focuses on how testers can maximize their efficiency using these tools.
Why Web Developers and Testers Rely on Chrome DevTools
Before discussing the technical aspects of Chrome DevTools, it's crucial to understand why this tool is indispensable for developers and testers. Due to the complexity of modern web apps, debugging tools have evolved to handle intricate code, network activities, and performance monitoring. Chrome Debugging Tools stand out because it is easily accessible, intuitive, and highly customizable.
The ability to view a website's performance, inspect elements, and test responsiveness across multiple devices in real-time sets Chrome DevTools apart as a tool of choice. Additionally, it offers powerful JavaScript debugging capabilities, which are essential in today’s fast-paced software development lifecycle.
Getting Started with Chrome DevTools
Launching Chrome DevTools is simple. There are multiple ways to open it:
- Right-click on any page element. From the drop-down menu, select
Inspect. - Use a keyboard shortcut: Press
F12orCtrl+Shift+I(Windows) orCmd+Option+I(Mac). - From Chrome’s menu: Go to the three-dot menu in Chrome > More Tools > Developer Tools.
Once opened, you’ll see several tabs, each serving a specific purpose for debugging, performance monitoring, and security testing.
Key Features of Chrome DevTools and How to Use Them
Chrome DevTools offers a rich feature set that can significantly streamline your testing process. Below, we explain some of the key features and how testers can use them efficiently:
1. Elements Panel:
- Purpose: Inspect and modify the DOM and CSS of the webpage.
- How to Use: You can hover over elements on the page to see their styles. By right-clicking and selecting Inspect, you can instantly view the underlying HTML and CSS and make live changes. This is useful for checking if CSS changes behave as expected without altering the source code.
2. Console:
- Purpose: Execute JavaScript and track logs in real-time.
- How to Use: Use the Console to debug JavaScript issues, track console logs, and test small code snippets. This feature is highly valuable for identifying dynamic content and interactive element bugs.
3. Network Panel:
- Purpose: Monitor and analyze network activity.
- How to Use: When you load a page, the Network panel records all the requests made by that page. You can inspect how long each resource takes to load, check for failed requests, and ensure that API calls behave correctly under different network conditions.
4. Performance Panel:
- Purpose: Analyze the performance of a web application.
- How to Use: Click on Record to monitor the application’s performance, including CPU usage, rendering times, and memory allocation. This helps you understand how the app performs under load, which is crucial for ensuring optimal user experience.
5. Application Panel:
- Purpose: Manage storage, cookies, and service workers.
- How to Use: The Application tab lets you view cookies, local storage, session storage, and cached resources. You can also inspect Service Workers, critical for Progressive Web Apps (PWAs), and ensure offline functionality works as intended.
How to Integrate DevTools with HeadSpin
Integrating Chrome DevTools with HeadSpin brings the power of real-world testing into your debugging workflow, allowing you to test mobile browsers on real devices from any remote location. Here’s how you can achieve this:
1. Open an Android device from the HeadSpin.
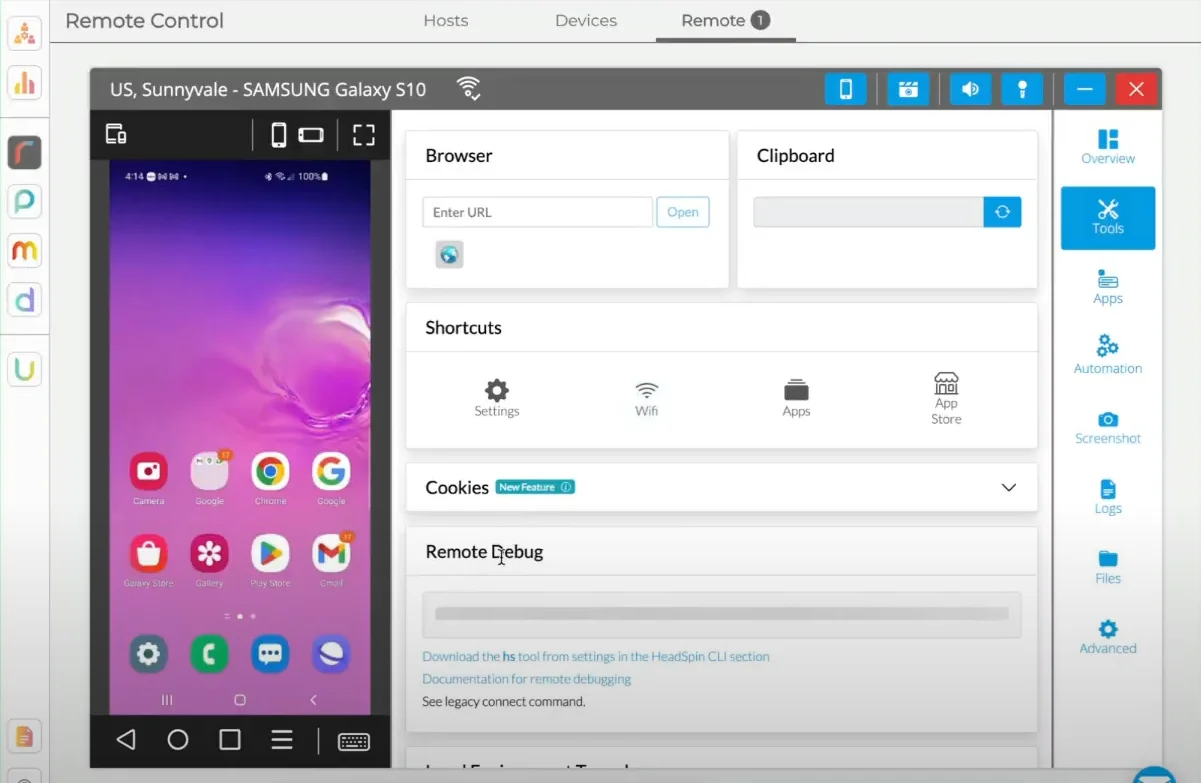
2. Under ‘Remote Debug’ in the Tools section, copy the command. A prerequisite for Remote Debugging is the HeadSpin CLI. Here’s how you can install it.
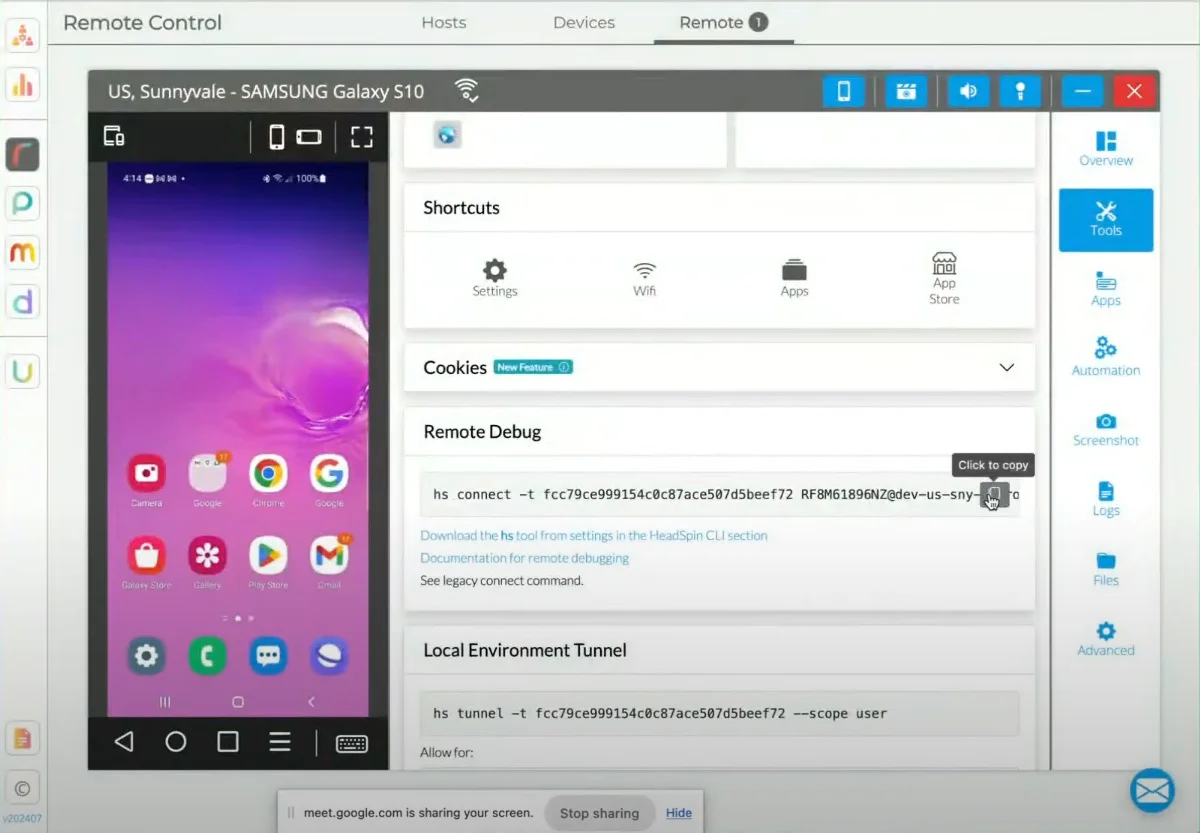
3. Paste the command in your terminal. This will bridge the remote device to your local system.

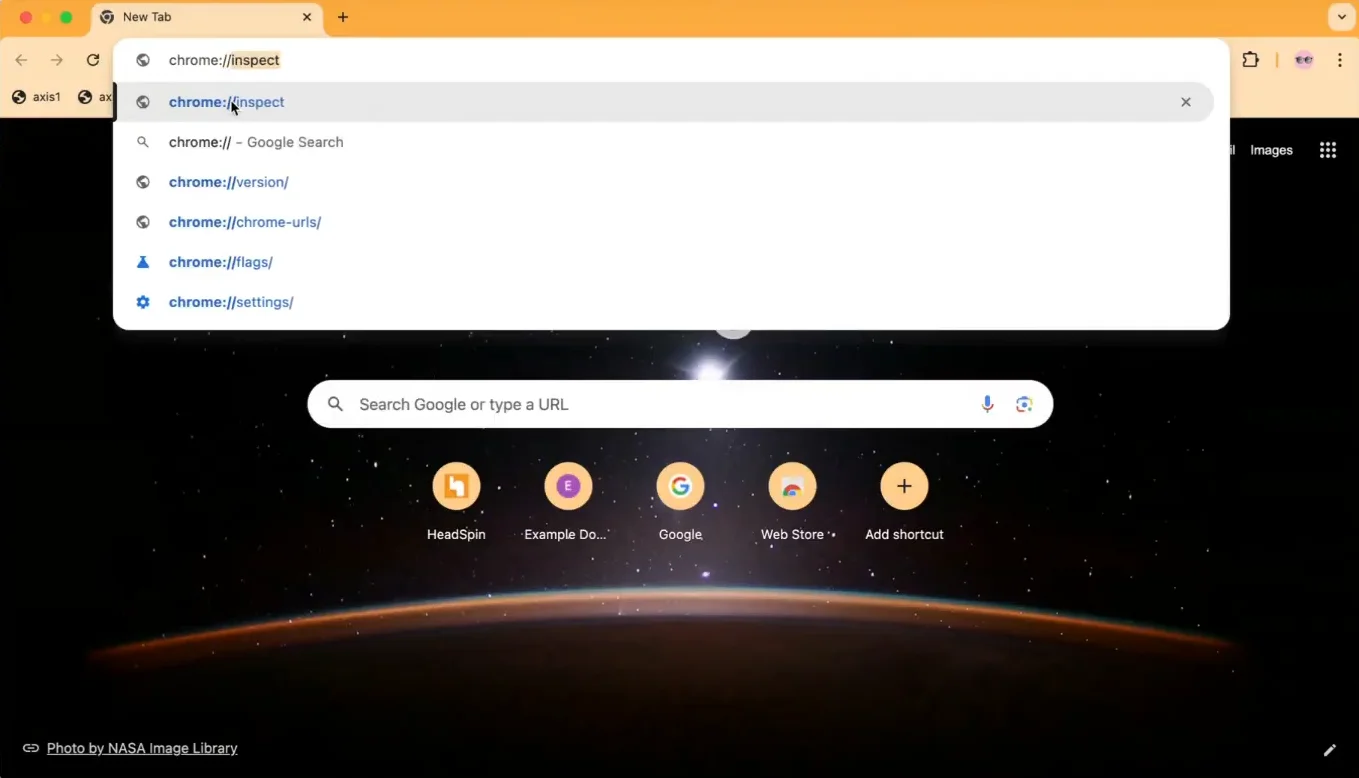
4. Open the webpage you want to inspect, on the remote device

5. On Chrome Browser, open chrome://inspect to see the connected device and inspect it.
6. Select your remote device and click inspect.
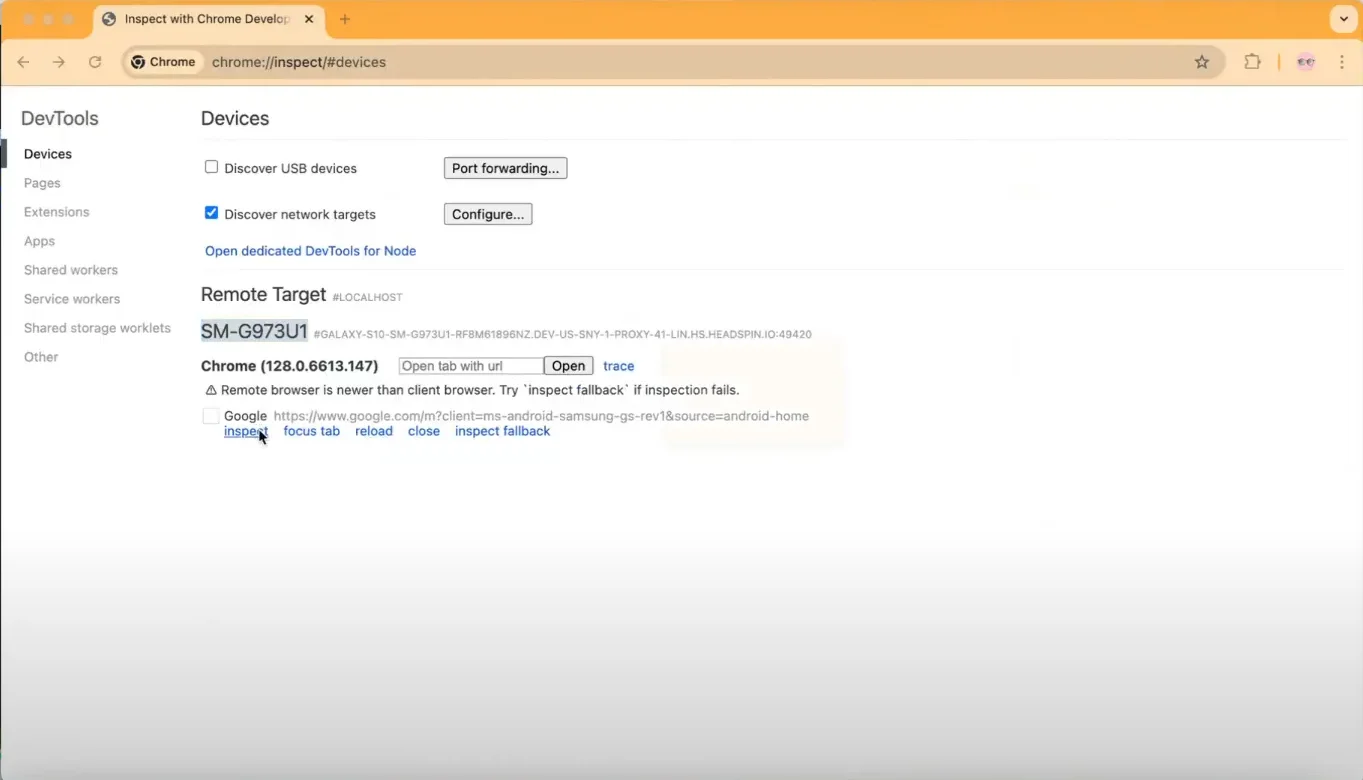
7. This opens DevTools on your device.
HeadSpin allows users to remotely leverage Chrome DevTools on real mobile browsers from any location. By providing access to real devices through its global infrastructure, HeadSpin enables testers to use Chrome DevTools for debugging, performance monitoring, and network testing directly on actual mobile devices, no matter where they are located.
Here’s more information on this:
Remote Access to Chrome DevTools
With HeadSpin, testers can remotely access Chrome DevTools on real devices, including mobile and desktop environments. This allows you to inspect, debug, and test web applications as they perform on actual hardware rather than relying on emulators or simulators. Using HeadSpin’s global device cloud, you can open Chrome DevTools from anywhere, gaining the same functionality you would have locally.
Automated Performance Monitoring
Chrome DevTools’ performance monitoring features, such as network throttling and CPU usage insights, can seamlessly integrate into HeadSpin’s automated test execution. HeadSpin collects performance metrics from real devices during test runs, enabling testers to correlate DevTools’ insights, such as page load time and network request analysis, with HeadSpin’s device-based data. This helps identify bottlenecks affecting user experience in various network and device conditions.
Live Debugging and Issue Resolution
HeadSpin’s platform enables live debugging on remote devices. You can initiate a test session, access Chrome DevTools on the selected device, and interact with the application in real-time. This is particularly useful for inspecting issues that are environment-specific or difficult to reproduce in local setups. By debugging on devices across different regions, you can resolve issues related to specific geographies or network conditions.
Advanced Network Insights
Using Chrome DevTools with HeadSpin's network monitoring capabilities gives you comprehensive insights into how applications handle network requests in real-world conditions. You can monitor network traffic, evaluate server response times, and assess your application's performance under different network speeds, such as 3G or 4G. This detailed view of network performance ensures your app delivers a great user experience, regardless of the user’s network environment.
Device-Specific Testing
With HeadSpin, you can access various device types, OS versions, and network conditions. Chrome DevTools provides granular control over what’s happening inside the browser, while HeadSpin ensures these tests occur on real devices, giving you accurate results. This helps you catch device-specific issues that may not be visible during local testing, ensuring broader test coverage and better performance on diverse devices.
Advanced Debugging Techniques with Chrome DevTools
Once you’re familiar with the basic functionality of Chrome DevTools, you can explore more advanced techniques to speed up your debugging and optimize web performance. These advanced features allow developers and testers to dive deeper into the code and diagnose issues that may not be immediately visible. Let’s explore a few of these techniques.
1. Debugging JavaScript with Breakpoints
Breakpoints are an essential part of debugging JavaScript. Rather than adding console.log() statements throughout your code, you can use Chrome DevTools to set breakpoints that pause execution at certain lines of code, allowing you to inspect variables, the call stack, and the application's state.
- Conditional Breakpoints: Conditional breakpoints allow you to set conditions to be met before the execution is paused. For example, suppose you want the breakpoint to trigger only when a variable reaches a certain value. In that case, you can right-click on the line number, choose "Add conditional breakpoint," and specify the condition. This technique helps in reducing unnecessary stops during debugging.
- XHR Breakpoints: These allow you to pause execution when a specific network request is made, such as an API call. This is highly useful when testing interactions between the front-end and back-end systems.
2. Blackboxing Scripts
When dealing with third-party libraries or frameworks that aren’t central to the problem you’re debugging, Chrome DevTools allows you to “blackbox” these scripts. This feature tells DevTools to ignore specific scripts during debugging so you can focus solely on the code you wrote. This makes stepping through your code more efficient, especially if external libraries are being loaded but don’t need attention.
- How to Blackbox Scripts: To blackbox a script, go to the Sources panel, open the script you want to ignore, right-click the filename, and select “Blackbox script.” This is useful when testing large-scale applications with numerous third-party libraries.
3. DOM Breakpoints for Dynamic Content
DOM breakpoints are a powerful way to monitor page structure changes when working with dynamic web applications. These breakpoints allow you to pause JavaScript execution when changes are made to a specific element or its children.
- Use Case: If you have an issue where a button disappears, or an element's style changes unexpectedly, setting a DOM breakpoint on that element will help you understand what script or event caused the change.
4. Memory Profiling
Chrome DevTools provides comprehensive tools for monitoring and improving memory usage. If you suspect your web application suffers from memory leaks or inefficient usage, the Memory panel lets you capture snapshots and analyze memory allocations.
- Heap Snapshots: A heap snapshot is a record of memory usage at a specific point in time. By comparing snapshots taken at different times, you can track down leaks and identify which objects are unnecessarily retained in memory.
- Allocation Timelines: The allocation timeline allows you to track memory usage over time, helping you understand the performance of long-running applications and how resources are consumed.
5. Analyzing Runtime Performance with the Performance Panel
The Performance panel in Chrome DevTools is vital for understanding your application's behavior during runtime. It provides detailed insights into rendering times, CPU usage, and memory consumption, helping you pinpoint performance bottlenecks.
- Flame Chart: The flame chart visualizes the CPU activity during the runtime of your web app. By analyzing this chart, you can quickly identify functions that take too long to execute and optimize them for better performance.
- Layout Shift Tracking: Chrome DevTools can also track layout shifts, essential for monitoring Cumulative Layout Shift (CLS), a key metric in web performance. This helps ensure that unexpected changes in the layout during runtime are minimized, improving the user experience.
6. Network Throttling for Simulating Different Conditions
When testing web applications, it’s essential to understand how they perform under various network conditions. Chrome DevTools offers network throttling to simulate slower connections like 3G, 4G, or offline scenarios.
- Custom Network Profiles: DevTools allows you to create custom network profiles that match real-world conditions you want to simulate during testing. This ensures your application can handle slower connections without sacrificing the user experience.
- Offline Testing: By setting the network condition to
Offline, you can test how your application behaves when network connectivity is lost. This is especially important for Progressive Web Apps (PWAs) and offline applications.
7. Auditing Accessibility with Chrome DevTools
Accessibility is vital to modern web applications, and Chrome DevTools provides built-in tools to help you audit your website for accessibility issues. Using the Lighthouse panel, you can generate detailed reports on your application’s accessibility, SEO, and performance.
- Lighthouse Audits: The Lighthouse tool runs a comprehensive audit of your web page, focusing on best practices for accessibility, SEO, and performance. The results offer actionable recommendations on how to improve each of these areas.
8. Debugging WebAssembly
As more applications leverage WebAssembly (Wasm) to achieve near-native performance, Chrome DevTools has also evolved to provide debugging capabilities for Wasm code. With support for stepping through WebAssembly, you can inspect the Wasm modules loaded into your application and debug them just as you would with JavaScript.
Read: A Step-by-Step Guide to Measuring Your Website Performance
Conclusion
Chrome DevTools is an indispensable tool for developers and testers alike. By mastering its features and understanding how to use them effectively, you can improve the speed and quality of your testing process. Integration with platforms like HeadSpin can further expand the capabilities of Chrome Debugging Tools, allowing you to test and optimize applications on real devices in real-world scenarios.
FAQs
Q1. What are the prerequisites for using Chrome DevTools?
Ans: You can use Chrome DevTools in every Chrome browser. You don't need specific tools or extensions—just right-click any page and select "Inspect" to get started.
Q2. Can Chrome DevTools be used for mobile testing?
Ans: Yes, you can use Chrome DevTools for emulation to simulate mobile environments. However, tools like HeadSpin are recommended for full-scale mobile testing.
Q3. Is Chrome DevTools useful for backend testing?
Ans: While primarily focused on front-end testing, Chrome DevTools can help analyze network requests and API calls, which are part of back-end operations.
Q4. How does HeadSpin enhance the functionality of Chrome DevTools?
Ans: HeadSpin enables you to remotely access Chrome DevTools on real devices, providing real-world testing capabilities. This integration helps you debug web applications on actual mobile and desktop devices from any location.


-1280X720-Final-2.jpg)


