AI-Powered Key Takeaways


Table of Contents

Benchmark testing measures an application's performance against a reference point, such as a previous release, a target, an industry standard, or a competitor. It helps teams determine whether performance has improved, declined, or remained stable.
Performance issues often develop gradually. Small code changes or heavier assets can introduce slowdowns that go unnoticed without a baseline for comparison.
Benchmark testing helps teams track performance across releases, set measurable targets, and evaluate technical changes. This guide covers its types, process, key metrics, sample test cases, best practices, tools, and how HeadSpin supports benchmarking.
What Is Benchmark Testing?
Benchmark testing in software testing is a way of measuring an application's performance under controlled, repeatable conditions and comparing the results against a baseline. It looks at things like speed, stability and resource use.
A few terms make the idea easier to follow.
- Benchmark. The standard you compare against, such as a previous release, a service level target, an industry figure or a competitor's result.
- Baseline. The set of measurements taken from a known good version under known conditions. Future results are compared to it.
- Controlled conditions. The same hardware, network, data and workload on every run, so any difference comes from the software and not the setup.
Benchmark software testing is often described as a subset of performance testing. Performance testing explores how a system behaves under different loads and finds its limits. Benchmark testing is narrower and more repeatable. It runs the same tests each time to see whether results are moving in the right direction.
Why Is Benchmark Testing Important?
Benchmark testing gives teams a reliable way to track performance over time instead of relying on guesswork.
1. Catches Regressions Early
When a build performs worse than the baseline, teams can identify the slowdown while the cause is still easier to investigate.
2. Sets Clear, Realistic Targets
Instead of vague goals like “make it fast,” teams can set measurable targets, such as keeping the login API response time under 300 ms at the 95th percentile.
3. Guides Technical Decisions
Benchmarks show whether a new database, library, cloud setup, or device configuration improves or reduces performance.
4. Improves User Experience
Speed and responsiveness affect how users experience an application. Benchmarks help teams maintain consistent performance as the product evolves.
5. Enables Competitive Comparisons
Comparing application performance against competitors helps teams identify gaps that internal testing alone may not reveal.
6. Supports Release Decisions
Comparing results against agreed performance thresholds helps teams decide whether a build is ready for release or requires further optimization.
7. Prevents Costly Surprises
Identifying performance slowdowns during testing helps teams address them before they affect customers.
Also Read: Benchmarking Video Performance in 5G Networks
Types of Benchmark Testing
Benchmark tests can be grouped by what they measure. Many teams combine two or three types in a single plan.
1. Application Benchmarking
This type measures how a web or mobile app performs on key flows such as login, search or checkout, and compares the results with earlier versions or targets.
- Page load and screen render times
- API response times
- Behavior across devices, browsers and operating systems
2. Network Benchmarking
Network benchmarking measures how data moves between users and servers, whether on a local network, across a wide area network or over mobile data.
- Latency and bandwidth
- Packet loss and jitter
- Behavior on 3G, 4G, 5G and Wi-Fi conditions
3. Hardware Benchmarking
Hardware benchmarking measures how components such as the CPU, GPU, memory and battery perform. It helps decide whether infrastructure or devices can support the software.
- Processing speed under load
- Memory use and leaks
- Battery drain and heat on mobile devices
4. Database Benchmarking
Database benchmarking looks at how well a database handles queries and concurrent users.
- Query times and slow queries
- Indexing effectiveness
- Connection handling under peak load
5. System Benchmarking
System benchmarking evaluates servers, software, network and hardware working together. It's useful for end-to-end workflows and for finding which layer is the bottleneck.
- Full user flows from request to response
- Resource limits across the stack
- Behavior after infrastructure or configuration changes
6. Storage Benchmarking
Storage benchmarking checks how quickly data can be read and written on disks, SSDs and storage networks.
- Read and write speed
- Input and output operations per second
- Latency and queue depth
7. UX Benchmarking
UX benchmarking tracks how easy and pleasant an app is to use, and compares that against earlier versions or competitors. It mixes performance numbers with user-focused measures.
- Task success rate and time on task
- Error rates during key tasks
- Satisfaction scores such as the System Usability Scale or Net Promoter Score
- Perceived speed, such as how quickly useful content appears on screen
8. Competitive Benchmarking
Competitive benchmarking measures your app against comparable apps in the same market using the same tests, devices and networks.
- App launch and load times compared with rivals
- Video start time and smoothness for streaming apps
- Performance by region
Benchmarks can also be organized by workload, such as steady performance, expected peak load, stress beyond limits and scalability as resources grow. A practical plan often pairs one scope from the list above with one workload type.
Also read: Different types of Performance Testing
How to Perform Benchmark Testing: A Step-by-Step Process
A clear process keeps results comparable from one run to the next.
1. Define the Objective
Decide what question the test should answer. Examples include "Did the new release slow down checkout?" or "How does our app launch time compare with the top three competitors?"
2. Choose What to Test
Pick the components, pages, APIs or user flows that matter most, such as login, search, payment or video playback. Start small and expand once the process works.
3. Select Metrics and Targets
Choose the measurements that answer your question, such as response time, throughput, error rate and CPU use. Write down what a pass looks like, for example "95th percentile response time under 300 ms with under 1% errors".
4. Set the Baseline
Run the tests on a known good version under normal conditions, and record the results. This becomes the reference point for every later run.
5. Prepare a Realistic, Repeatable Environment
Match production as closely as you can in hardware, configuration, network and data. Keep it identical between runs, and note anything that could affect results, such as caches, background jobs or software versions.
6. Create Test Scripts and Data
Build scripts for the flows you chose, using realistic data and user behavior. Keep scripts under version control so the same test runs each time.
7. Run the Tests
Run each test several times, since a single run can be thrown off by noise. Add load gradually if the benchmark involves concurrency, and record the exact conditions.
8. Compare Results with the Baseline
Look at medians and percentiles, not just averages. Decide whether a difference is real or within normal variation, and read response time alongside throughput, errors and resource use.
9. Analyze, Fix and Retest
Trace slowdowns to their cause, whether that's code, a database query, a network issue or hardware. After a fix, rerun the same test under the same conditions to confirm the improvement.
10. Report and Repeat
Share results in a form people can read, such as dashboards and trend charts. Run the benchmark on a schedule or with every build so the baseline stays useful.
What Metrics Should You Measure in Benchmark Testing?
The right metrics depend on what you're benchmarking. These are the ones used most often.
Web and UX Metrics
For web experiences, add these user-focused measures.
- Largest Contentful Paint, which tracks how quickly the main content appears
- Interaction to Next Paint, which tracks how quickly the page responds to input
- Cumulative Layout Shift, which tracks unexpected movement of content
- Task success rate, time on task and satisfaction scores for UX benchmarks
Pick a small set of metrics that match your goal. Too many measures make results hard to read.
Benchmark Testing vs Performance Testing
The two are closely related, and people often mix them up. The easiest way to separate them is by the question each one answers.
In practice they work together. Performance testing tells you what your system can handle. Benchmark testing makes sure it keeps performing at that level as the product changes.
Also read - Performance Testing vs Load Testing: Key Differences Explained
Benchmark Testing Examples and Sample Test Cases
These examples show how benchmarks look in real projects. Targets are samples, so replace them with your own numbers.
Examples
- E-commerce checkout. A retailer records the time to complete checkout in each release and flags any version that is more than 10% slower than the baseline.
- Mobile banking app. A bank compares login and balance screen load times across phone models and networks after every sprint.
- Streaming service. A team compares video start time and buffering on the same devices against two competing apps.
- API change. A team checks that a refactored search API still returns results within the same percentile targets at the same load.
- Database upgrade. An engineering team runs the same query set before and after a database upgrade to confirm nothing slowed down.
Sample Test Cases
What Are the Challenges of Benchmark Testing?
1. Inconsistent Environments
Small differences in hardware, software versions, network or background load can change results more than the code does. Without control, comparisons mislead.
2. Unrealistic Workloads and Data
A benchmark built on tiny data sets or unrealistic user behavior can look great and still miss real problems. Workloads should reflect how people actually use the product.
3. Network and Device Variation
Mobile networks and devices change from moment to moment and place to place. A test on a fast office connection and a flagship phone doesn't represent most users.
4. Noise Versus Real Regressions
Results vary naturally from run to run. Teams need repeated runs and an agreed margin so they don't chase false alarms or miss real slowdowns.
5. Cache and Warm-Up Effects
First runs and later runs can behave very differently. Mixing cold and warm results hides what users experience, so they should be recorded separately.
6. Looking at a Single Metric
A faster response time may come with more errors or higher CPU use. Reading metrics together gives a truer picture.
7. Fair Competitive Comparisons
Comparing against other apps only works if the tests use the same devices, networks, accounts and steps. Anything else tilts the result.
8. Cost and Slow Feedback
Large benchmarks take time and resources. Teams often need smaller checks on every build and fuller runs before releases.
Also Read: A Complete Guide to Mobile App Performance Testing
Benchmark Testing Best Practices for QA Teams
1. Start with a Clear Goal
Know what decision the benchmark will inform before you design it. That keeps the scope small and the results useful.
2. Use Production-Like Environments
Match infrastructure, configuration and data to production as closely as possible. Containers and infrastructure as code make environments easier to reproduce.
3. Keep Conditions Identical Between Runs
Change only the thing you're testing. Record versions, settings, devices and network conditions with every result.
4. Use Realistic Data and Scenarios
Build tests from real user journeys and anonymized production data, with a variety of requests and inputs.
5. Run Tests More Than Once
Use several runs and report medians and percentiles. This reduces the effect of random spikes.
6. Report Percentiles, Not Just Averages
Averages hide the slow experiences that frustrate users. P95 and P99 show what the worst-affected users see.
7. Separate Cold and Warm Results
Measure first launches and repeat visits separately, since users experience both.
8. Test on Real Devices and Networks
Emulators and fast office networks hide real-world problems. Include the phones and connections your users have.
9. Automate and Run in CI/CD
Run small benchmarks on every build and bigger ones on a schedule. Automated comparisons against the baseline catch regressions the same day they appear.
10. Refresh Baselines Deliberately
Update the baseline when you intentionally improve performance or change the product, and note why. Don't let it drift silently.
11. Archive Results
Keep reports, logs and raw data so you can compare across months and investigate when something changes.
12. Keep Humans in the Loop
Tools produce numbers, but people decide what's acceptable, design the scenarios, and judge whether a change matters.
Benchmark Testing Tools
The right tool depends on what you're measuring. The list below covers open source options first, with HeadSpin last.
1. Apache JMeter
JMeter is a long-running open source tool for load and performance tests on web apps, APIs and databases.
Features
- Supports HTTP, REST, SOAP, JDBC and more
- Builds repeatable test plans with timers and assertions
- Produces reports and works in CI pipelines
Best for: Repeatable benchmarks of web services, APIs and database queries
Pricing: Free and open source
2. Gatling
Gatling is a load testing tool where tests are written as code, which suits version control and CI.
Features
- Scenarios written in Scala, Java, Kotlin, JavaScript or TypeScript
- Detailed HTML reports with percentiles
- Efficient at generating large loads
Best for: Developers who want benchmark scripts kept in the code repository
Pricing: Open source edition is free, with paid enterprise options
3. k6
k6 is an open source load testing tool where tests are written in JavaScript.
Features
- Scripts in JavaScript with thresholds that pass or fail a run
- Outputs metrics to dashboards and monitoring tools
- Command line friendly for CI
Best for: API and service benchmarks with automatic pass or fail criteria
Pricing: Open source is free, with a paid cloud service available
4. Locust
Locust lets you describe user behavior in Python and run it at scale.
Features
- User scenarios written as plain Python code
- Web interface showing live statistics
- Distributed load generation across machines
Best for: Teams that prefer Python and need flexible, realistic user behavior
Pricing: Free and open source
5. Lighthouse
Lighthouse is Google's open source tool for auditing web page performance, accessibility and best practices.
Features
- Scores for performance and key web metrics such as LCP and CLS
- Runs in Chrome DevTools, from the command line or in CI
- Lists specific opportunities to improve load time
Best for: Benchmarking front-end page performance and web UX over time
Pricing: Free and open source
6. stress-ng
stress-ng is an open source tool that puts controlled load on CPUs, memory, disks and other system components.
Features
- Hundreds of stress methods for CPU, memory, I/O and more
- Reports throughput rates for repeatable comparisons
- Runs from the command line on Linux
Best for: Hardware and system benchmarking on servers and test machines
Pricing: Free and open source
7. HeadSpin
HeadSpin is a platform for testing web and mobile apps on real devices and networks around the world, with built-in performance measurement.
Features
- Real devices, including mobile and OTT, in 50+ global locations
- 130+ performance KPIs with build-over-build and competitor comparison
- Works with Appium and Selenium and plugs into CI/CD pipelines
Best for: Benchmarking mobile and web experience on real devices and networks, including against competitors
Pricing: Cloud packages and Custom usage based pricing
Leveraging HeadSpin for Benchmark Testing
Open source tools measure servers and pages well, but many benchmarks depend on how an app behaves on real phones, real networks and real locations. HeadSpin helps teams cover that side of the picture.
- Real devices, including mobile and OTT, across 50+ global locations, so benchmarks reflect what customers actually use
- 130+ performance KPIs, including response times, CPU, memory, frame rate, battery and network metrics
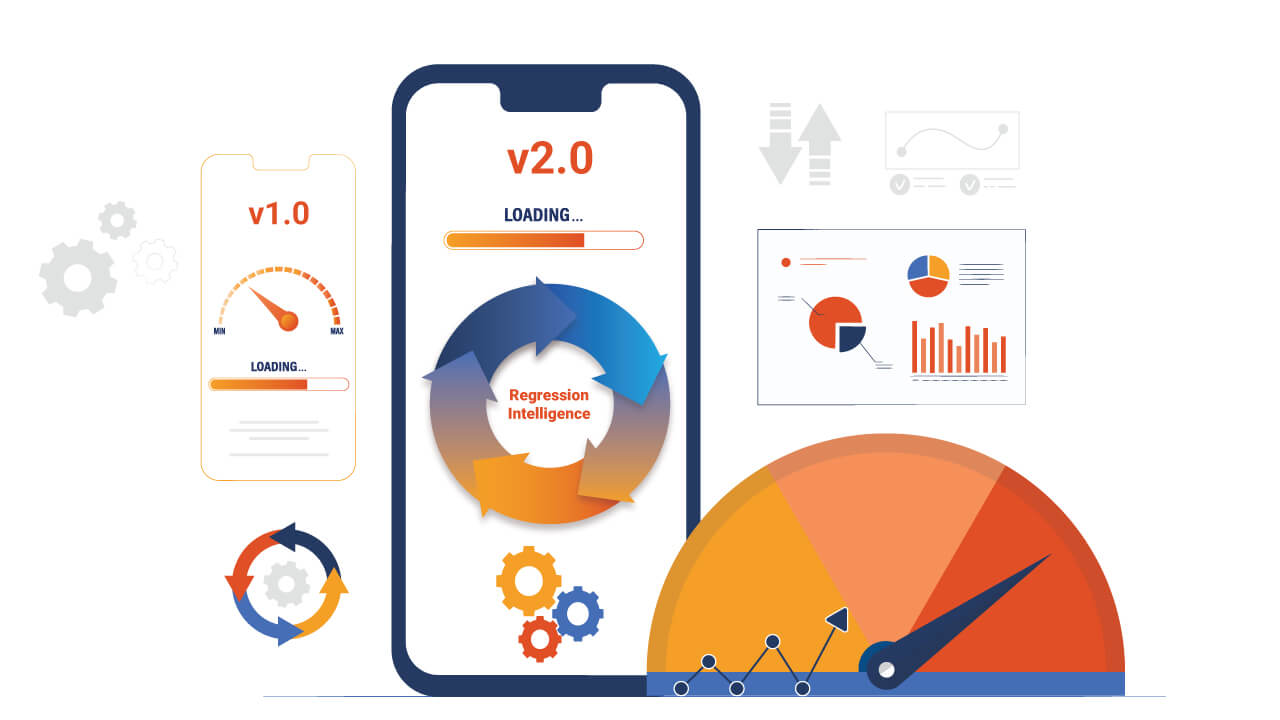
- Regression Intelligence to compare builds and flag performance changes against a baseline
- Waterfall UI and session data to see where time is spent and find the root cause of a slowdown
- Appium and Selenium support, with CI/CD integration, so benchmark runs can happen on every build
Conclusion
Benchmark testing gives teams a clear, repeatable way to answer whether their software is getting better, staying the same or slipping. It works best when the goal is clear, the environment is steady, the baseline is recorded and results are read as percentiles across several runs.
Use the types that match your questions, from application and network to hardware, UX and competitor benchmarks. Pair benchmark testing with performance testing so you know both what your system can handle and whether it keeps meeting that standard release after release.
Teams that need benchmarks on real devices, real networks and real locations can use HeadSpin to run them consistently and compare results over time.
FAQ's
Q1. What is a baseline in benchmark testing?
Ans: A baseline is a set of results from a known good version under known conditions. Future test results are compared against it to see whether performance has changed.
Q2. How often should you run benchmark tests?
Ans: Run small, fast benchmarks on every build, and fuller benchmarks before major releases, after big changes and on a regular schedule.
Q3. Which metrics matter most in benchmark testing?
Ans: Response time (as percentiles), throughput, error rate and resource use cover most cases. Mobile and web apps also benefit from launch time, frame rate, battery use and user-focused web metrics like LCP and INP.
Q4. Can benchmark testing be automated?
Ans: Yes. Tools like JMeter, Gatling, k6 and Locust can run benchmark scripts in CI/CD pipelines and compare results against thresholds automatically. Humans still decide what the benchmarks should be and how to read the results.
Q5. Why test benchmarks on real devices?
Ans: Real devices and networks show true performance, including CPU limits, memory pressure, battery drain and carrier network behavior that emulators and fast office connections hide.