


.png)


.png)


AI-Powered Key Takeaways


Introduction
A user’s screen may load more slowly on a particular device, a request may take longer in one region, or a layout may shift only under specific network conditions.
Many of these issues never show up during testing because teams rely on lab setups or a limited set of devices that does not reflect what real users use. These environments test on ideal connectivity scenarios and do not expose how application behaviour changes across regions and carriers. As a result, problems that occur only on real devices and real networks go unnoticed until users encounter them.
That is where HeadSpin steps in with testing on real devices across 60+ cities in 50+ global locations.
Let us learn more in detail in this blog post.
6 Ways Teams Use HeadSpin to Check User Journeys Across Devices and Locations
1. Testing user journeys on real devices
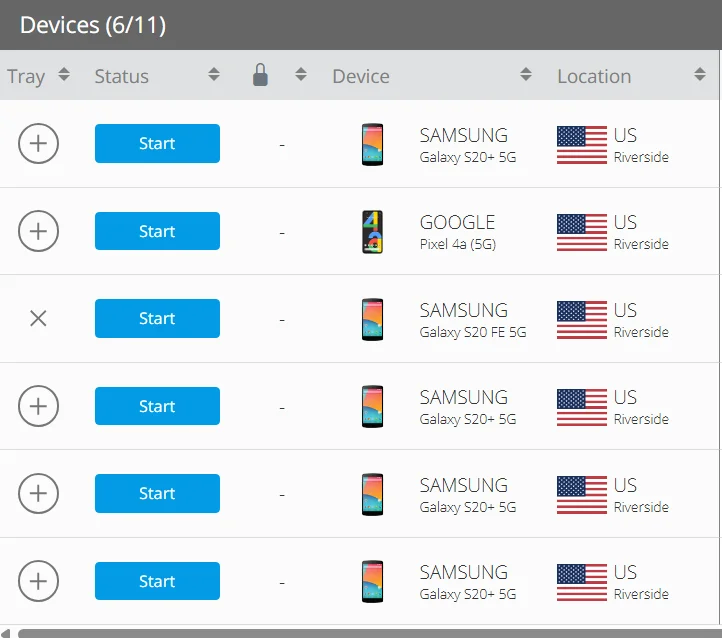
QA teams can select real devices from the HeadSpin device pool to reflect the devices their users actually use. These include different models, OS versions, screen sizes, and hardware profiles. Teams run the same user journey across these devices to observe how each step behaves. This helps them identify layout shifts, delayed gestures response, animation issues, and timing differences that do not appear in simulated environments.
For example, a sign-in screen may render correctly on one device but show misaligned fields or overlapping text on another. HeadSpin lets teams see these issues exactly as users experience them.
2. Capturing the entire journey with session data
.webp)
Every test creates a session that includes a video of the journey, along with network logs, device logs, performance metrics, and resource data. The HeadSpin waterfall UI places these details on a single timestamped view.
Testers watch the screen recording to follow the user flow while checking what happened beneath the surface. If a screen takes longer to load, they can look at DNS timing, SSL setup, or a slow API to understand why. This removes guesswork and gives them a reliable way to trace behaviour across steps.
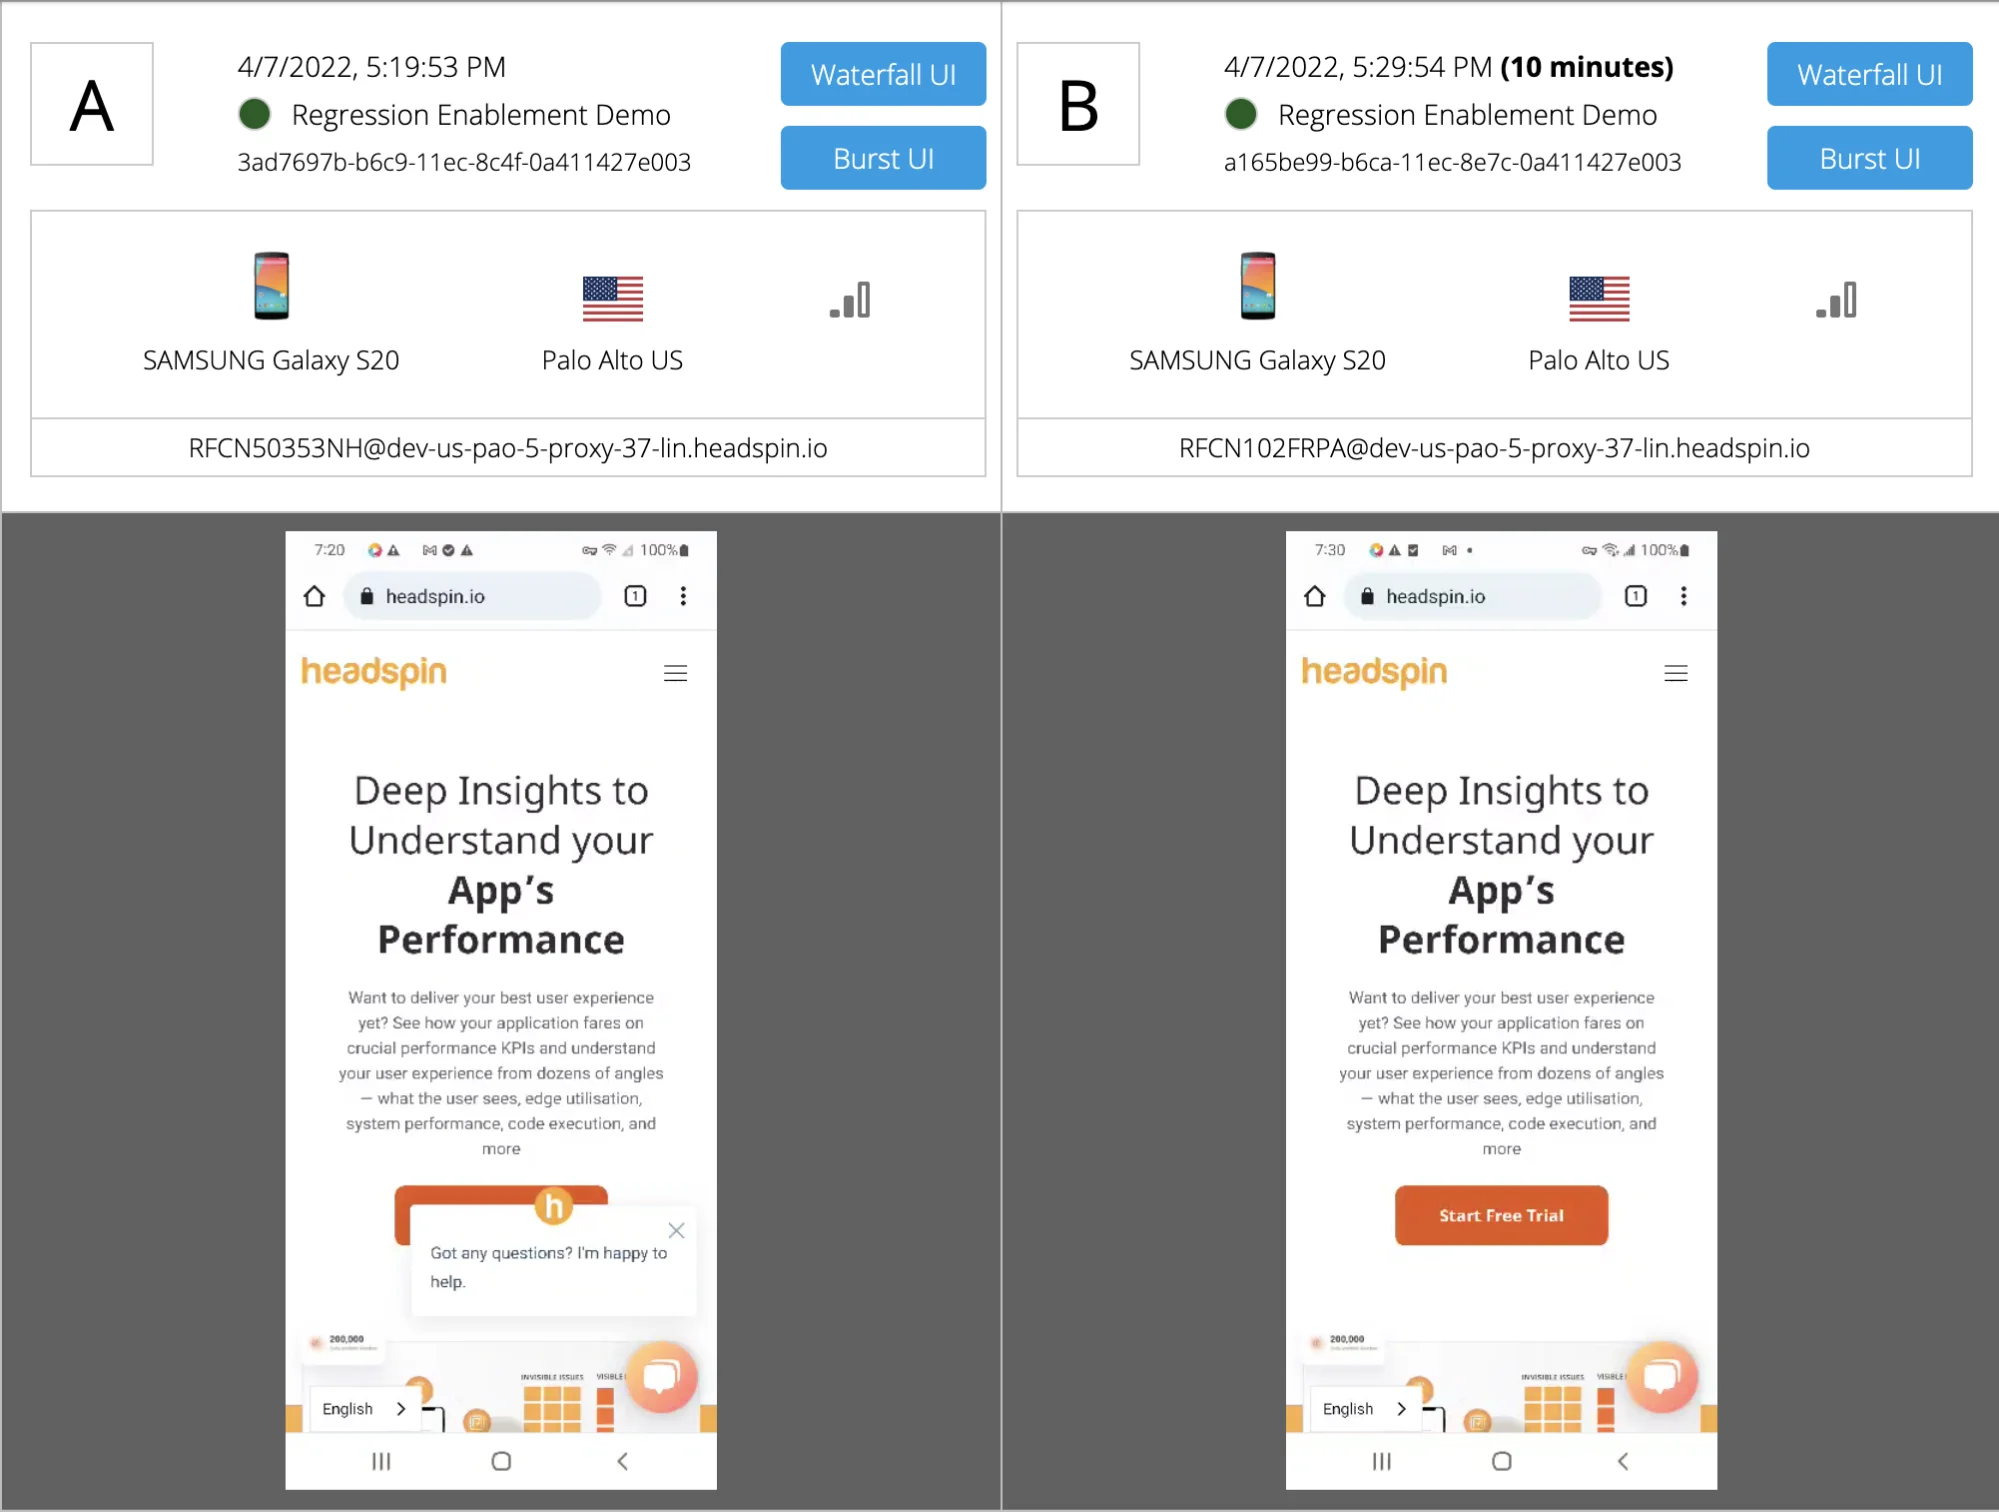
3. Comparing device behaviours side by side
Consistency is essential for user journeys. A feature may work on one device but pause or render differently on another. HeadSpin allows teams to compare multiple sessions to study differences. This helps them see where the journey diverges and why. A slight delay during checkout may be linked to CPU usage on a low-tier device. A repeated animation stutter may appear only on one OS version. Side-by-side comparison makes these findings clear without manual stitching of data.
4. Testing journeys across regions
Products behave differently in different markets. Network quality, routing patterns, localisation rules, pricing, and media delivery can all influence how each step feels.
HeadSpin addresses this by offering multiple deployment options based on how teams want to test. QA teams can access HeadSpin-managed devices placed in real user locations, running on local carrier networks. For organisations with stricter requirements, HeadSpin also supports on-prem device deployments (including air-gapped setups) where devices are hosted within customer-controlled environments or specific regions.
Because these devices operate on real networks, teams can observe delays caused by carrier routing, regional traffic patterns, or CDN behaviour. This makes it possible to validate how the same user flow behaves when executed from different locations.
5. Studying network performance on each step
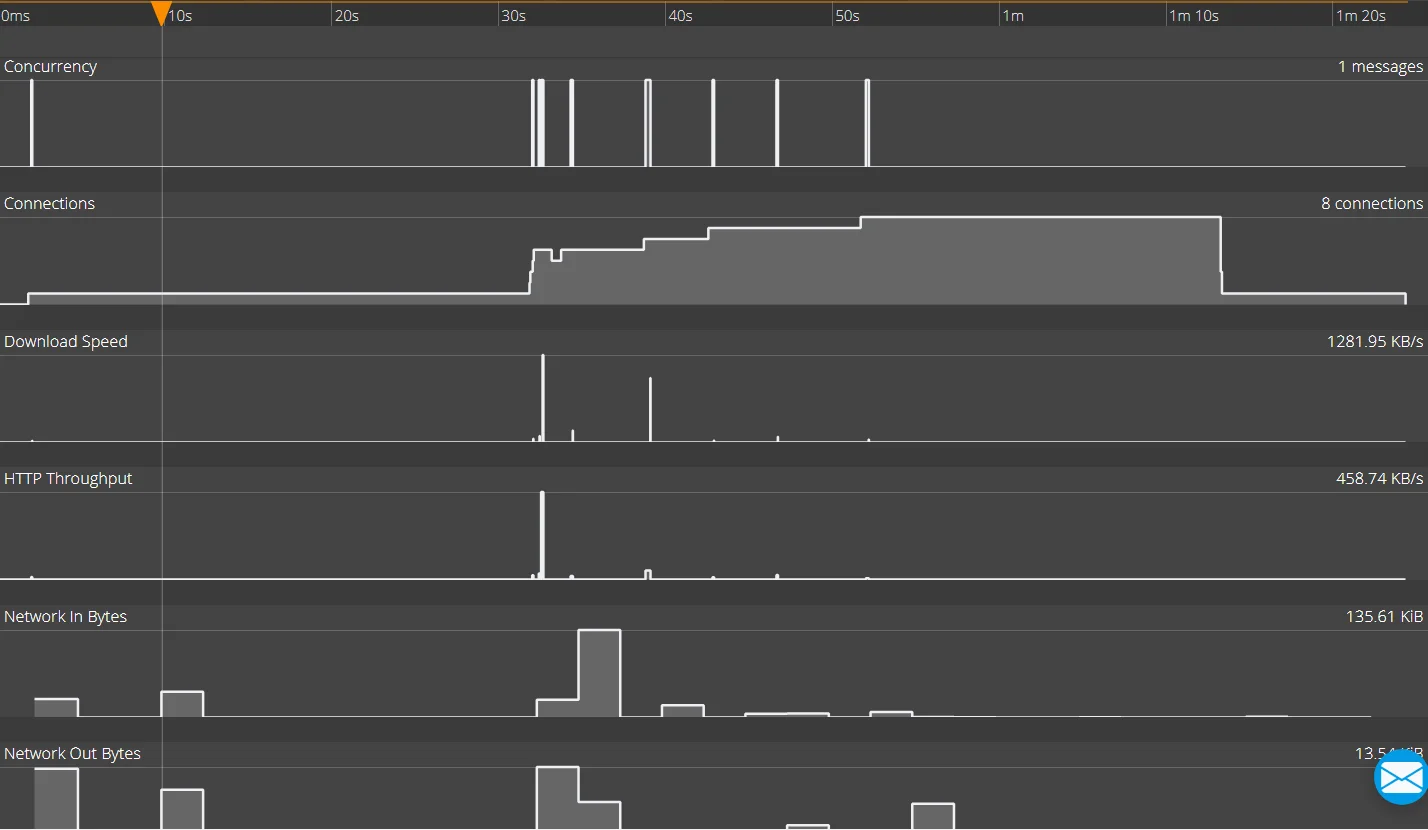
Network behaviour can shape the journey. Packet loss, latency spikes, HTTPS throughput and media download patterns all affect how long steps take.
HeadSpin captures detailed network performance KPIs for every session. Testers use this data to identify the exact point in the flow where the journey slows.
Example: A checkout screen loads instantly on office Wi-Fi but takes 6 to 8 seconds on a specific mobile carrier. Using HeadSpin’s real devices connected to that carrier, QA teams can replay the exact session and see the payment API request stalling in the network timeline. The session data confirms the delay occurs only on that carrier path, not on the application logic itself.
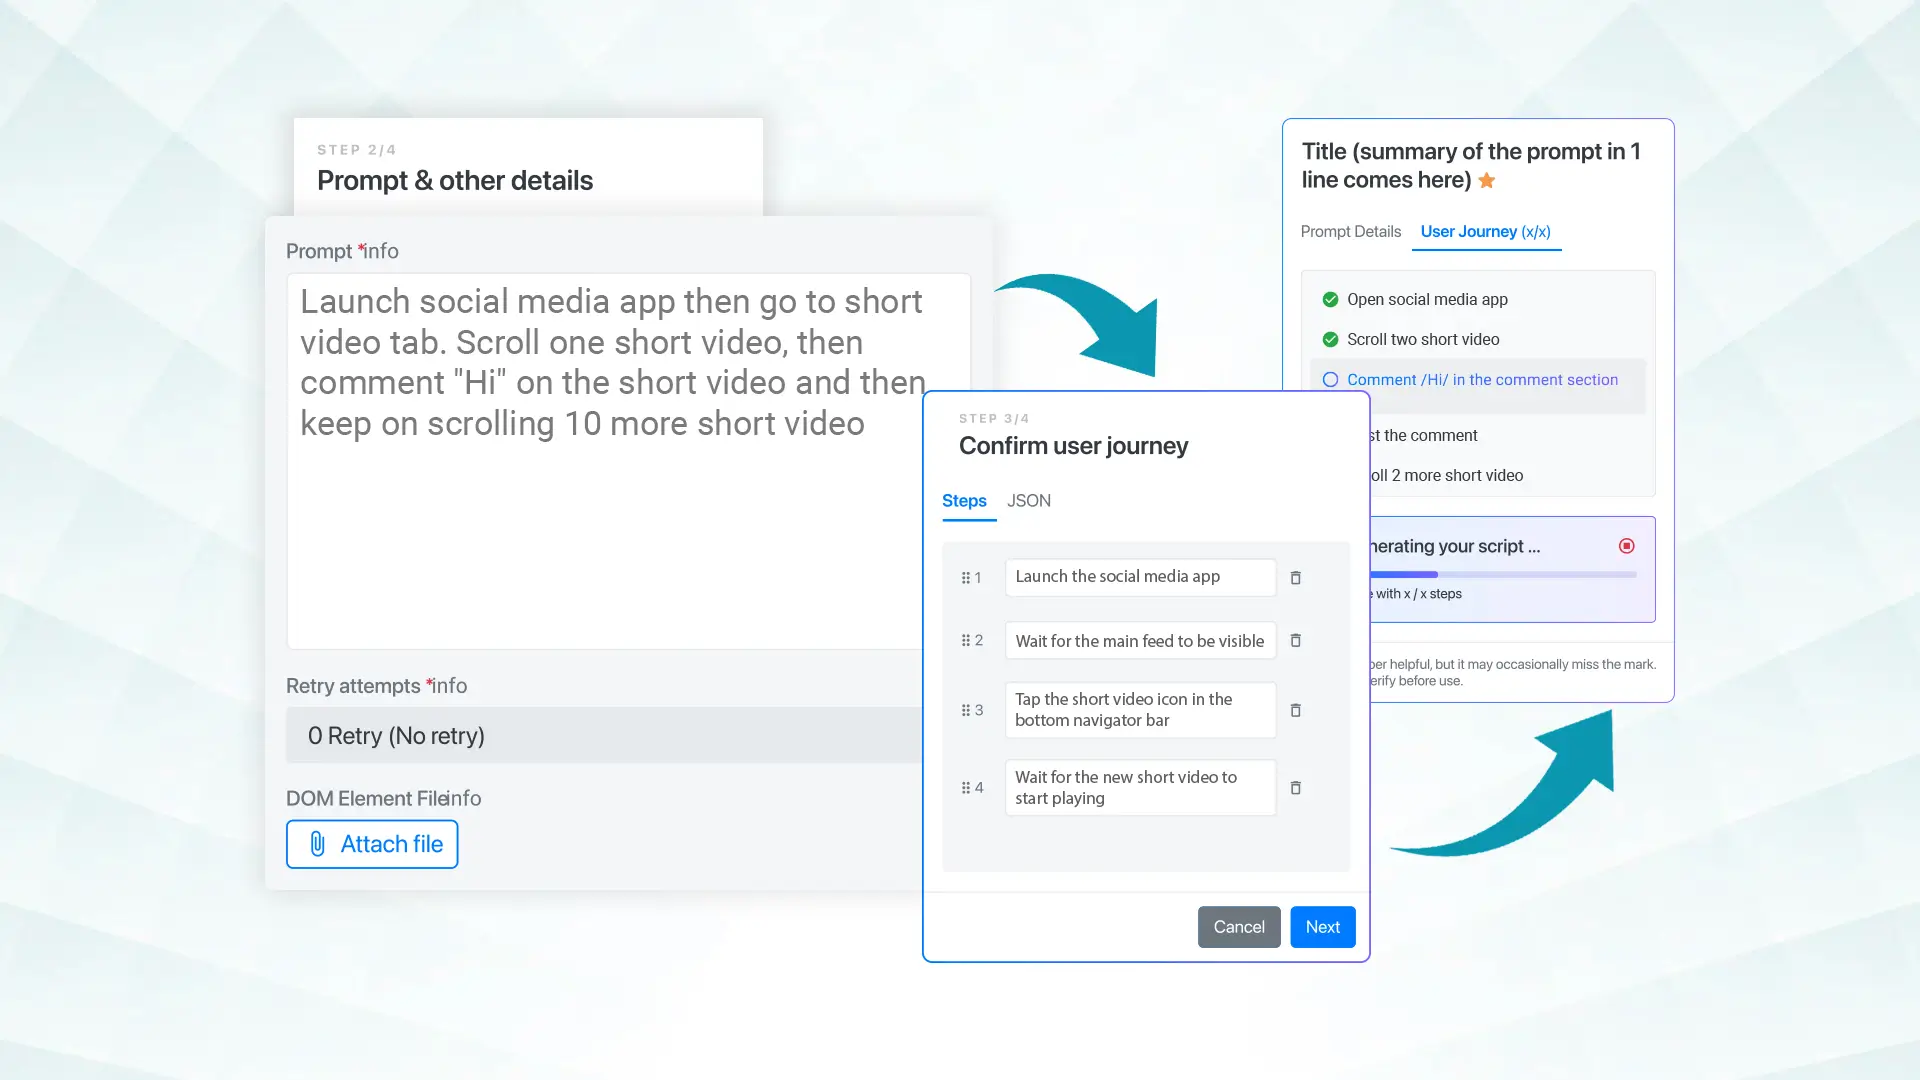
6. Combining manual and automated journey tests
HeadSpin supports both manual testing and automated end-to-end tests on real remote devices. QA teams can test the same user flows manually on real devices or through automation scripts. Each test execution is captured as a single session with screen recording, network activity, and device metrics, allowing teams to review results, compare behaviour across devices and regions, and identify regressions across releases..
The Way Forward
Teams that want reliable user journeys need a testing setup that reflects real use. This requires real devices, real networks, and data that explains why a step slows down or behaves differently. HeadSpin gives QA teams this foundation. It helps them run journeys across devices and regions, compare results, and study how UI behaviour, network conditions, and device performance shape the experience.
Validate every step of the user journey with HeadSpin’s real device cloud! Explore HeadSpin.
FAQs
1. Why do QA teams need real devices for user journey testing?
Ans: Real devices show behaviour that simulators cannot. Differences in hardware, OS builds, graphics rendering, and network handling can change how each step in the journey performs. Testing on real devices helps teams catch layout issues, slow interactions, and performance gaps that only appear in real conditions.
2. How does HeadSpin help teams compare user journeys across regions?
Ans: HeadSpin supports build-over-build comparison, allowing teams to run the same user journey on different builds in the same regions and review session data side by side. This helps teams see whether a regional issue already existed in a previous build or was introduced by a recent change, instead of relying on assumptions or one-off observations.
3. Can automated tests on HeadSpin capture full journey behaviour?
Ans: Yes. Automated tests on HeadSpin record the same data as manual tests, including video, logs, and network metrics. This gives teams a consistent way to track changes across builds and makes it easier to detect regressions in multi-step flows.


Debangan Samanta
Product Manager, HeadSpin Inc.


-1280X720-Final-2.jpg)


