.png)


.png)



AI-Powered Key Takeaways


Table of Contents

Introduction
A webpage can look perfectly fine on a desktop and still break on an Android phone. A button may sit outside the viewport, a menu may cover important content, or a form field may stop responding after the mobile keyboard opens.
The fastest way to understand what is happening is to inspect the affected element.
The challenge is that Chrome on Android does not provide the same right-click Inspect option available on desktop browsers. Developers and testers must instead use desktop browser simulation, remote debugging, Android Studio, Appium Inspector, or a real-device testing platform.
This guide explains how to use inspect element Android methods for mobile websites, native applications, and hybrid apps. It also clarifies which option works best for each testing requirement.
What Is Inspect Element on Android?
Inspect Element is a debugging capability that exposes the structure and properties behind what appears on the screen.
For a mobile webpage, it can show:
- HTML elements in the Document Object Model
- CSS rules applied to each element
- JavaScript errors and console output
- Network requests and API responses
- Image, font, and script loading
- Event listeners and accessibility properties
- Element dimensions, spacing, and positioning
For a native Android application, inspection works differently. Native apps do not have an HTML DOM. Instead, tools such as Android Studio Layout Inspector and Appium Inspector display the application’s UI hierarchy.
Depending on the tool, testers may be able to inspect properties such as:
- Resource ID
- Accessibility ID or content description
- Class name
- Text value
- Bounds and coordinates
- Enabled, selected, clickable, and visible states
- Parent and child elements
- Compose or View attributes
It is also important to understand that changes made through Inspect Element are temporary. Editing a heading, hiding a button, or changing a CSS property only affects the current browser session. It does not modify the website’s source code or change what other users see.
Also Read - How to Inspect Element on Mac
Why Use Inspect Element on Android?
Inspecting elements gives developers and QA teams direct evidence of what the Android device is rendering. Instead of guessing why an interface has broken, they can examine the element, its properties, and the surrounding application state.
1. Debug Mobile Layout Problems
Inspect Element can reveal why content is overlapping, disappearing, stretching beyond the viewport, or appearing differently across screen sizes.
For example, a developer can check whether a fixed width, incorrect media query, excessive margin, or inherited CSS rule is pushing a checkout button off the screen.
2. Test Responsive Design
Desktop browser tools can simulate different viewport sizes and device pixel ratios. This allows developers to check how quickly a design adapts when moving between common phone, tablet, and desktop dimensions.
Real-device inspection goes further by showing how the page behaves with an actual mobile browser, physical display, keyboard, touchscreen, and operating system.
3. Investigate JavaScript Errors
The Console and Sources panels in Chrome DevTools help developers identify JavaScript exceptions, failed event handlers, incorrect values, and scripts that do not behave as expected on mobile.
4. Analyze Network Activity
The Network panel shows the requests made while a webpage loads or while a user completes an action.
Developers can use it to identify:
- Failed API calls
- Slow resources
- Incorrect response codes
- Large images and scripts
- Missing files
- Authentication problems
- Requests blocked by browser security policies
5. Find Elements for Test Automation
Automation tools need reliable locators to identify buttons, fields, menus, and other interface components.
Element inspection helps testers find properties such as resource IDs, accessibility IDs, CSS selectors, and class names that can be used in Selenium or Appium scripts.
Stable identifiers should generally be preferred over long XPath expressions that depend heavily on the current screen hierarchy.
6. Examine Native Android Interfaces
For native apps, inspection tools reveal how the screen is organized beneath the visible interface.
This can help developers locate overlapping views, confirm element attributes, investigate Compose recompositions, and understand why an automation framework cannot find a particular component.
Also Read -How to Inspect Element on iPhone?
4 Different Ways to Inspect Elements on Android Devices in 2026
The right method depends on whether you are testing a website, a native application, or an automated mobile journey.
1. Use Chrome DevTools Device Mode
Chrome DevTools Device Mode is the quickest option for checking how a website responds to different mobile viewport sizes.
It runs on a desktop browser and simulates selected mobile-device characteristics. No Android phone is required.
> How to Use Chrome Device Mode
- Open the website in Chrome on your computer.
- Press
F12orCtrl + Shift + Ion Windows and Linux. On macOS, pressCommand + Option + I. - Select the Toggle device toolbar icon in DevTools.
- Choose an Android device profile from the device list.
- Reload the webpage if required.
- Open the Elements panel.
- Select the element picker and click the element you want to inspect.
- Review its HTML, applied styles, dimensions, and accessibility properties.
You can also change the viewport dimensions manually, rotate the simulated screen, adjust zoom, and apply network throttling.
> When to Use This Method
Chrome Device Mode works well for:
- Early responsive-design checks
- CSS troubleshooting
- Testing media queries
- Comparing common viewport sizes
- Reproducing simple mobile layout problems
- Checking touch-oriented page states
> Limitation
Device Mode is a simulation. It does not reproduce every difference caused by the physical device, Android version, browser build, graphics hardware, manufacturer settings, keyboard, or touchscreen.
Use it for fast development checks, not as the final proof that a website works correctly on Android.
2. Use Chrome Remote Debugging on a Physical Android Device
Chrome Remote Debugging is generally the best way to inspect a mobile webpage running on an Android device you already have.
The webpage runs in Chrome on the phone, while the full DevTools interface opens on your computer. This gives you the convenience of desktop debugging while preserving the behavior of the real mobile browser.
This is the most practical method when someone searches for inspect element Chrome mobile, inspect element Chrome Android, or inspect element on mobile Chrome.
Step 1: Enable Developer Options
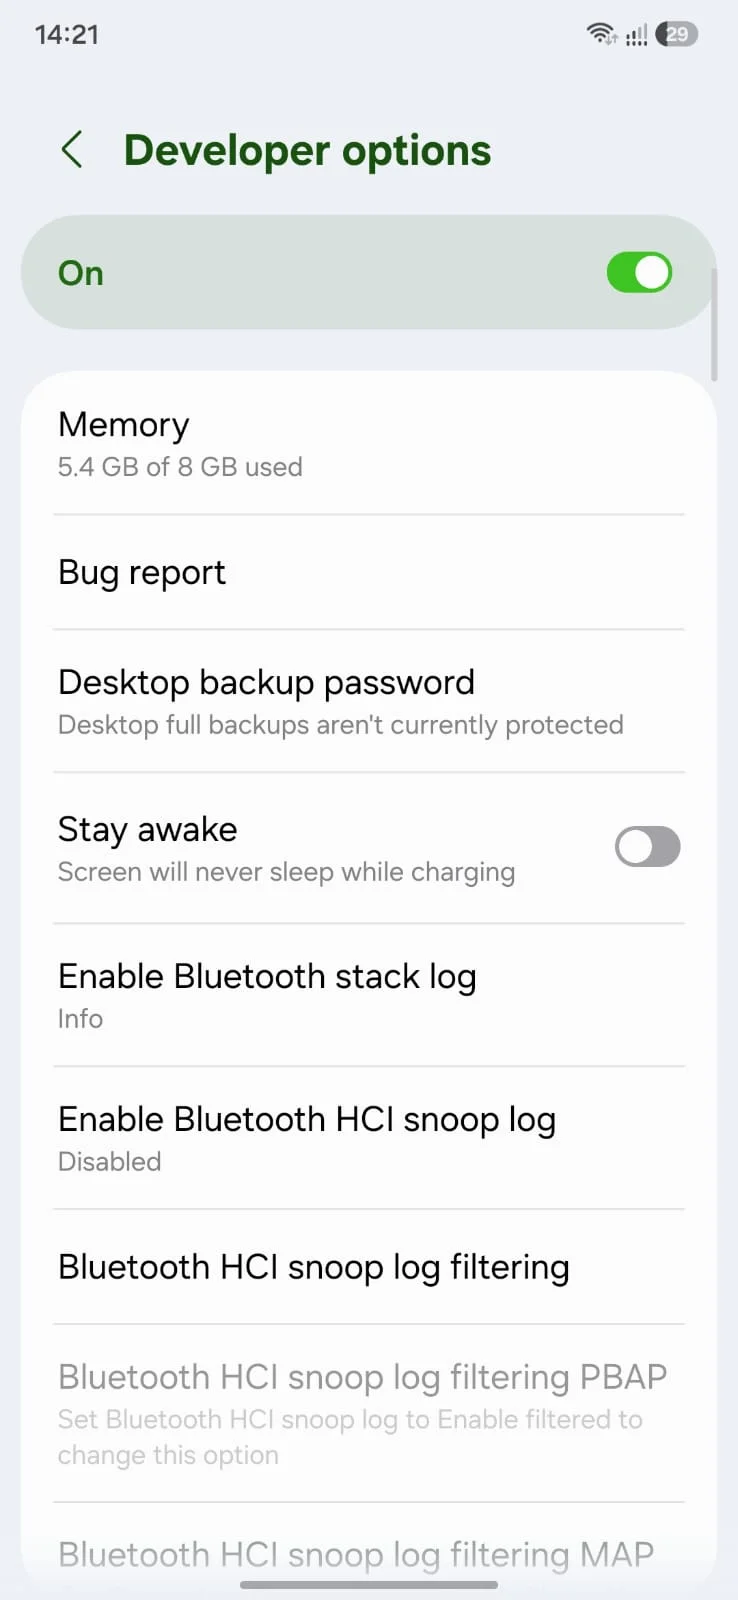
The exact menu names can vary between manufacturers, but the general process is:
- Open Settings on the Android device.
- Select About phone.
- Locate Build number.
- Tap Build number seven times.
- Enter the device PIN or password when prompted.
- Return to Settings and open Developer options.
Step 2: Enable USB Debugging
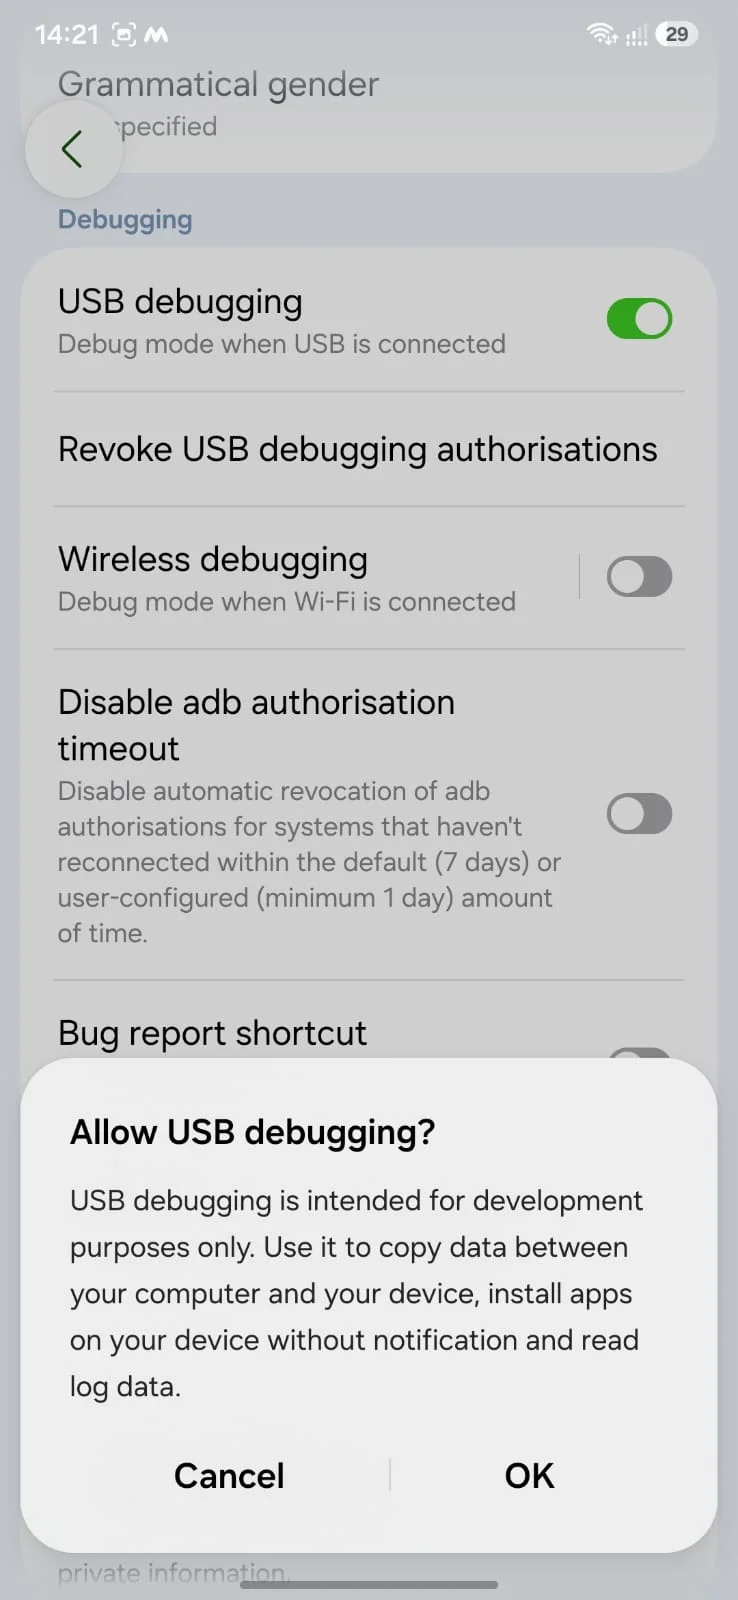
Inside Developer Options:
- Find USB debugging.
- Turn it on.
- Confirm the warning displayed by Android.
USB debugging allows the computer to establish a debugging connection with the device.
Step 3: Connect the Android Device
Connect the phone directly to your computer using a data-capable USB cable.
Unlock the phone and accept the Allow USB debugging prompt. You may also choose to remember the computer if it is a trusted development machine.
A cable that only supports charging will not work.
Step 4: Open the Website on Android Chrome
Open Chrome on the Android device and navigate to the webpage you want to inspect.
Leave the page open while completing the next steps.
Step 5: Discover the Device in Desktop Chrome
On the computer:
- Open Chrome.
- Enter
chrome://inspect/#devicesin the address bar.
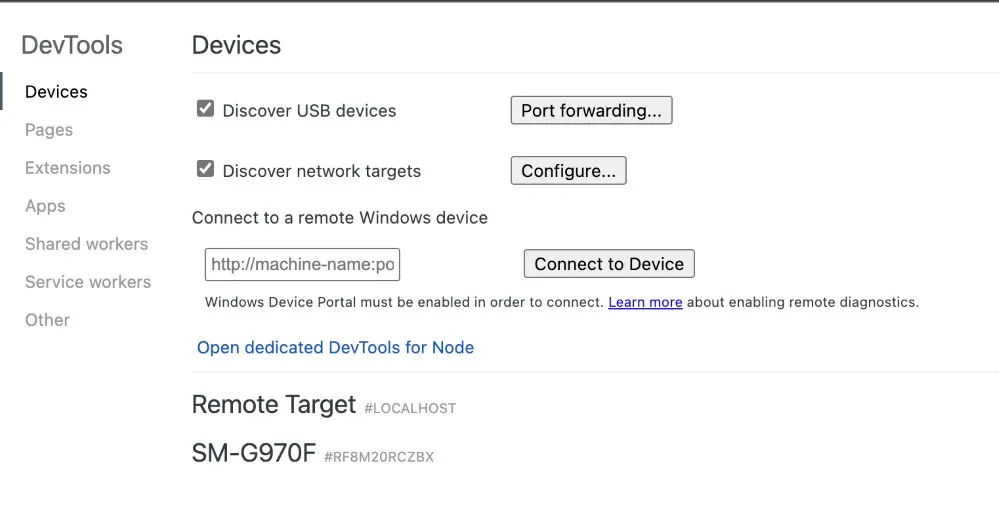
- Make sure Discover USB devices is enabled.
- Locate the connected Android phone.
- Find the open Chrome tab listed beneath the device.
- Select Inspect.
A DevTools window will open for that mobile browser tab.
Step 6: Inspect the Element
Open the Elements panel and activate the element selector.
You can then either:
- Select an element in the DevTools screencast
- Tap the corresponding element on the Android device
- Browse the DOM manually
Chrome highlights the selected element on the device and displays its HTML and CSS in DevTools.
You can also use the Console, Network, Sources, Performance, Application, and Accessibility tools to investigate the page more deeply.
> Common Connection Problems
When the device does not appear in chrome://inspect, check the following:
- The phone is unlocked.
- USB debugging is still enabled.
- The debugging authorization prompt was accepted.
- The USB cable supports data transfer.
- The phone is connected directly rather than through an unreliable hub.
- The correct OEM USB driver is installed on Windows.
- Chrome is open on both devices.
- The target webpage is open in an Android Chrome tab.
Running adb devices can help diagnose the connection, but installing and using ADB manually is not required for the standard Chrome remote-debugging workflow.
> Can Remote Debugging Work Over Wi-Fi?
Android also supports ADB-based wireless debugging. Android 11 and later can pair compatible devices with a development workstation over Wi-Fi, although the setup is more involved than a direct USB connection.
USB remains the simpler option for occasional inspection.
3. Use Android Studio Layout Inspector for Native Apps
Chrome DevTools is designed for web content. It cannot inspect the native UI hierarchy of a standard Android application.
For native apps built with Android Views or Jetpack Compose, use Android Studio Layout Inspector.
Layout Inspector connects to a running, debuggable application on an emulator or physical device. It displays the component hierarchy and the attributes associated with each UI component.
> How to Use Layout Inspector
- Open the Android application project in Android Studio.
- Connect a physical Android device or launch an Android Emulator.
- Run a debuggable build of the application.
- Open the Running Devices window.
- Select Toggle Layout Inspector.
- Choose the foreground application process if it is not selected automatically.
- Click a component in the layout display or Component Tree.
- Review its properties in the Attributes panel.
The Component Tree shows the parent-child relationship between elements. This is particularly useful when several views overlap or when the selected component is nested inside multiple containers.
> What Can Layout Inspector Show?
Depending on the app and Android Studio version, Layout Inspector can help you:
- Examine View and Compose hierarchies
- Review dimensions and layout attributes
- Select hidden or overlapping components
- Isolate part of a complex component tree
- Compare the current layout with a design image
- Capture layout hierarchy snapshots
- Investigate Compose recompositions and skipped recompositions
- Move from a visual component to the related source code
> When to Use This Method
Layout Inspector is best when:
- You are developing the application
- You have access to its source code
- The app is running as a debuggable process
- You need to understand the native UI structure
- You are troubleshooting Compose or View layouts
- The problem is related to how Android renders or arranges components
It is not intended for inspecting arbitrary production applications that you do not own or cannot run in a debuggable state.
4. Use Appium Inspector for Native, Hybrid, and Automated Tests
Appium Inspector is designed for mobile test automation.
It provides a visual representation of the application screen and its UI hierarchy. Testers can select an element, review its attributes, test locator strategies, interact with the app, and generate code that can be used in Appium scripts.
The Appium documentation recommends Inspector as a tool for visually examining applications and discovering element locators.
> Basic Appium Inspector Workflow
- Install Appium and the required Android driver.
- Start an Appium server.
- Connect an Android device or emulator.
- Open Appium Inspector.
- Enter the Appium server address and session capabilities.
- Start the inspection session.
- Navigate to the required application screen.
- Select an element in the screenshot or hierarchy.
- Review its properties and available locator strategies.
- Test the locator before adding it to the automation script.
Appium commonly uses the UiAutomator2 driver for Android automation. Current Appium setup options can install the required mobile drivers and Inspector components.
> Properties Available in Appium Inspector
The attributes shown depend on the application and automation driver, but they can include:
resource-idcontent-descclasstextboundsclickableenableddisplayedselectedcheckedXPath
Appium Inspector can also generate starter code for interacting with the selected element.
> Choosing Better Locators
A locator should remain usable even when the visual layout changes slightly.
Where possible, prefer:
- Accessibility ID
- Resource ID
- Stable platform-specific selectors
- Short, carefully designed XPath expressions
Avoid copying a long absolute XPath without reviewing it. A locator tied to every container in the current hierarchy may break when a developer adds or rearranges a single component.
> When to Use This Method
Appium Inspector is the better choice when:
- You are creating or maintaining Appium tests
- You need selectors for native app elements
- The app contains both native and WebView content
- You want to test a locator before coding it
- You need to inspect application states reached during a test
- You are working with remote Android devices
Which Method Is Best for Inspecting Elements on Android?
There is no single best method for every Android application.
For mobile websites, begin with Device Mode and move to remote debugging on a real Android device before release.
For native apps, use Layout Inspector while developing the interface and Appium Inspector when building automated tests.
For broader compatibility testing, repeat the inspection on the Android models, OS versions, browsers, and screen sizes that represent your actual users.
How HeadSpin Simplifies Android Element Inspection
HeadSpin gives teams remote access to real Android devices without requiring every tester to maintain a local device collection.
Its browser-based Remote Control interface includes an integrated Appium Inspector. Testers can inspect the application’s view hierarchy, identify selectors, interact with elements, and generate scaffold Appium code while working with a remote device.
The Inspector supports HeadSpin’s supported Android devices and can work with native and hybrid application contexts. Teams can also connect remote HeadSpin Android devices to a local Android Studio environment for debugging when required.
This allows QA and development teams to move from element inspection to real-device testing and automation without depending on a single locally connected phone.
Conclusion
Inspecting elements on Android becomes much easier once you choose a tool that matches the type of application being tested.
Chrome DevTools Device Mode is useful for quick responsive checks. Chrome Remote Debugging provides full DevTools access for websites running on a physical Android phone. Android Studio Layout Inspector exposes the structure of native interfaces, while Appium Inspector helps testers identify elements and build mobile automation.
The important part is not simply knowing how to open an inspector. It is knowing whether you are examining a simulated webpage, a live mobile browser, a native UI hierarchy, or an automation context. That distinction determines what the tool can show and how reliably the results represent the user experience.
FAQs
Q1. Do I need to root an Android device to inspect elements?
Ans: No. Rooting is not required for Chrome Remote Debugging, Android Studio Layout Inspector, or standard Appium inspection.
You may need to enable Developer Options, USB debugging, or a debuggable application build, depending on the selected method.
Q2. How do I inspect elements in a native Android app?
Ans: Use Android Studio Layout Inspector when you are developing the app and have access to a debuggable build.
Use Appium Inspector when you need to identify locators, inspect UI attributes, interact with elements, or create automated mobile tests.
Chrome DevTools is only suitable for web content, such as Chrome tabs and debuggable WebViews.
Q3. Are changes made through Inspect Element permanent?
Ans: No. Changes made through Chrome DevTools only affect the current browser session.
Refreshing or closing the page normally removes them. Permanent changes must be made in the application or website source code and then deployed through the normal development process.







-1280X720-Final-2.jpg)