AI-Powered Key Takeaways
Introduction
As software solutions incorporate disruptive technologies, applications become more complex and distributed. It is essential to observe application performance to ensure end-users are satisfied with their experience.
Application observability is critical in guaranteeing optimal service delivery to customers and identifying issues impacting application performance. Categories like load time and application response time observe application performance. Observability maintains defined service levels and promptly resolves performance-related issues for customers.
Inadequate network performance, causing slow or unavailable access to applications, is often due to recent configuration changes, resource scarcity, offline switch ports, bandwidth bottlenecks, or ISP WAN link issues. Managing networks and applications separately create silos of data and requires significant manual effort to correlate and understand issues, resulting in errors and delays. A more effective approach is to adopt network observability practices that integrate application data with network data to quickly identify and resolve issues, ensuring continuous access to critical applications and an optimal user experience.
The Role of Application Observability in Delivering Perfect Digital Experiences
Application observability tools are critical in observing end-users, systems, and network infrastructure transaction speeds. By detecting bottlenecks and potential service interruptions, observability enables system administrators to identify and diagnose the root cause of performance problems more efficiently. This, in turn, helps ensure a consistent service level, promoting an optimal user experience.
Adopting an integrated observability solution offers a holistic perspective on the performance metrics of business-critical applications. Observability tools furnish real-time alerts for performance issues and generate comprehensive reports with data for performance analysis, enabling IT teams to repair, enhance, or upgrade application software as necessary.
Observability tools comprise monitoring solutions that track various performance metrics related to two fundamental aspects: the performance perceived by users, which encompasses load and response times during peak usage, and the capacity of computational resources, which serves to establish a performance baseline and identify potential bottleneck locations.
Learn more: Simulating Different Network Conditions for Virtual Devices
Why Is the Correlation Between Application and Network Performance Data Important for Identifying the Root Cause of Faults?
The key to delivering a seamless application lies in identifying any potential faults. The faster these faults are identified, the sooner they can be addressed. However, when using disparate tools, the performance of networks and applications may only be evaluated in isolation, lacking any correlation between them. As a result, analyzing various reports manually can become cumbersome and time-consuming, requiring considerable effort to pinpoint the source of a fault.
Application-aware Network Performance Management is a comprehensive approach to observing applications from a network perspective, offering a correlated view of application and network performance data. This powerful solution provides valuable insights into applications' impact on your network and the reverse, helping you identify precisely where a fault may lie. Its in-depth visibility into application and network performance allows for quick and efficient fault diagnosis, facilitating the prompt resolution of any issues.
Learn More: Important Uses of Mobile App Performance Testing Tools
Network observability is an essential process within IT, providing administrators with the tools necessary to optimize network performance. This is particularly important in organizations that have strict reliability requirements or operate within complex network architectures. By observing networking components such as servers, routers, switches, and virtual machines (VMs) for performance, IT professionals gain valuable insights into how their network is functioning and can take action to ensure that it continues to meet the demands of their organization.
Network observability is a critical process that enhances network visibility on-premises and across SaaS deployments. By evaluating how the network affects application performance, IT teams can better understand performance and the interdependencies between application and network topology. This, in turn, can reduce MTTR by facilitating collaboration between application and network teams. In instances where bottlenecks exist within the network, user experience can be negatively impacted. This underscores the importance of considering the user experience in network observability. By observing the network for bottlenecks and ensuring better throughput, IT professionals can work to provide an optimal user experience.
What Are the Key Metrics That SREs Should Consider for Network observability?
When observing the performance of a network, it is crucial to keep track of certain metrics. These metrics include errors, bandwidth, throughput, and latency.
Here's a brief explanation of each:
- Errors: This metric refers to the error percentage received due to network issues, such as packet loss. Packet losses occur when sent packets don't reach their destination. Measuring errors can help identify potential network issues and take corrective actions.
- Bandwidth: It measures the maximum amount of data a network can transfer within a specific period, usually measured in bits/second. Bandwidth measures the network's capacity and does not directly relate to the network's speed.
- Throughput: It measures the number of units of information a system can process within a specified period. Throughput affects the network's speed and determines the system's response time.
- Latency: It measures the time it takes for a data packet to travel from one point to another in the network. Latency is also known as delay; a low latency measurement is ideal. High latency can cause delays in the transmission of data and result in poor network performance.
Learn More: Capturing iOS Simulator Network Traffic with Appium
What Is the Ideal Process for Network observability That Developers Should Follow?
The process of observing network performance involves gathering data from various sources. This is done by observing flow data, Simple Network Management Protocol (SNMP), and packet capture.
- Flow data: Generated by network devices, this data provides information on device communication, duration and frequency of communication, and amount of data transferred.
- SNMP: A widely used protocol that observes and manages network device functions, such as routers or printers, enabling real-time observation of network changes or status.
- Packet capture: Aids observing network health, application performance, security, incident response, troubleshooting, and network capacity planning. Captures packets at a specific point in the network, storing them for analysis.
A network observability tool often includes a customizable dashboard with visualization and reporting capabilities. This tool should be able to collect and display packet capture, SNMP support, and flow data for analysis. The tool should enable users to swiftly isolate and examine the problem if issues arise. This feature can help detect and address network issues more efficiently, allowing users to maintain the health and integrity of the network.
Network observability can be utilized either on-premises, from the cloud, or in a hybrid manner that combines the two. This flexibility in deployment options allows users to select the most suitable method for their specific needs, enabling them to observe network performance effectively regardless of their setup.
The value of network observability for testers lies in the following aspects:
- Network observability can detect and prevent unusual system behavior, minimizing potential risks.
- A network observability tool can identify and reduce errors and latency, enhancing the end-user experience.
- Optimized performance can be achieved by identifying issues and gathering performance data.
- Some tools can detect malicious activity and flag potential security threats.
- Private cloud models offer greater control and flexibility, while public clouds can be more cost-effective.
- Virtualized and automated networks can enhance efficiency and scalability for enterprises.
What are the difficulties in network observability that developers are often faced with?
- Increased complexity can be challenging for some tools, as they may not have access to virtualized layers.
- IT teams must oversee automated activities in automated networks to ensure proper observability, which can be complicated.
- In some cases, VMs may not be able to communicate adequately, requiring IT teams to observe individual VMs and the hypervisor.
- Performance issues may be masked in virtualized and automated networks.
How Can HeadSpin's Unique Observability Capabilities Empower Businesses to Enhance Their Digital Experiences?
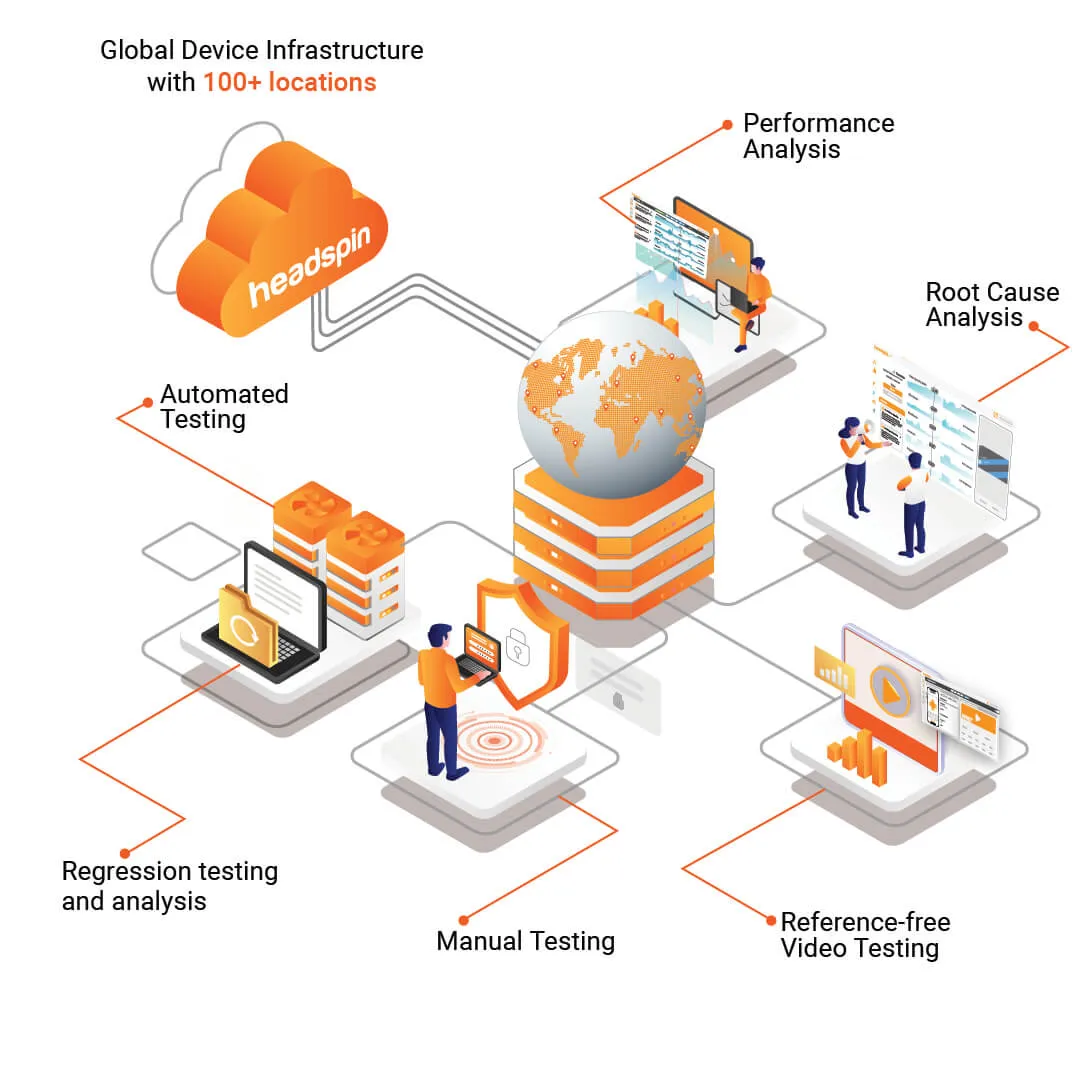
HeadSpin is a top-of-the-line digital experience observability platform that provides comprehensive coverage for all channels and devices. Its wide range of metrics, powerful analytics, and user-friendly tools enable enterprises to observe digital experiences, including application performance, under various network conditions. By leveraging HeadSpin, businesses can enhance their customer experience, accelerate time to market, and optimize the cost of their digital applications.
HeadSpin provides advanced application performance testing solutions that cater to diverse industries, including telecommunications. Its unique capabilities include the following:
- Measuring and observing 5G experiences
- Conducting edge evaluations for seamless app performance
- Monitoring roaming performance and client experience for both inbound and outbound traffic
- Enabling network throttling using HeadSpin Automation APIs
- Offering a continuous Quality of Experience (QoE), and Quality of Service (QoS) assessment framework encompassing RF metrics and more
Utilize the unique capabilities of HeadSpin's Digital Experience Monitoring Solution to:
- Access AI-powered insights and alerts that provide easily actionable recommendations
- Observe digital experiences across various delivery channels continuously
- Evaluate end-to-end key performance indicators (KPIs) for applications, networks, and devices
- Conduct remote global testing on actual devices across diverse networks
The HeadSpin Platform provides businesses with advanced capabilities to attain the pinnacle of software testing maturity. Its extensive range of features includes comprehensive performance reporting, user experience objectives, budget oversight, and continuous testing across various environments. HeadSpin is currently the sole Platform in the market that supports software testing at all stages of testing maturity.
What's Next?
Network-based application observability is a highly effective way to gain unparalleled visibility while maintaining the security and reliability of your infrastructure. However, selecting the appropriate vendor and tool can be a complex process that necessitates extensive research and often goes beyond just the technical capabilities of the tool. While some vendors may cater to smaller businesses with traditional network performance observability tools, most vendors address the challenges faced by larger businesses as a result of the heightened need for dependable network services. It is critical to choose a vendor that meets the unique requirements of your business to ensure optimal performance and success.
If you're looking for a reliable testing partner that caters to the needs of businesses of all sizes, HeadSpin's advanced performance observability capabilities are worth considering. The HeadSpin Platform offers comprehensive observability and analysis of your network infrastructure, applications, and end-user experience, enabling you to proactively identify and troubleshoot issues before they impact your business.
Discover how HeadSpin can help you optimize your network performance and ensure the success of your business. Book a Demo
FAQs
Q1. What are the three fundamental components of network security?
Ans: Certain organizations adopt best-in-class technology to bolster their cybersecurity measures, yet they may not possess adequate staffing or expertise to implement the technology to its fullest potential.
Q2. What are the basic factors for network observability?
Ans: In network observability, important metrics such as network availability, response time, CPU utilization, disk usage, and uptime are analyzed. Additionally, hardware parameters, including fan speed, temperature, and power supply status, are also evaluated by the monitoring system.


.png)


.png)


-1280X720-Final-2.jpg)


