AI-Powered Key Takeaways
Every app, website, or digital service depends on performance. If pages take too long to load, transactions fail, or the interface lags, users leave.
Performance testing helps teams identify these issues before they reach customers. But knowing what to measure is just as important as running the tests themselves. Tracking the right key performance indicators (KPIs) gives engineering and QA teams a clear picture of how apps behave in real-world conditions across different devices, networks, and geographies.
This guide outlines the essential performance testing metrics to track in 2026. These KPIs help teams detect bottlenecks, compare builds, and deliver smooth, reliable digital experiences.
KPIs To Focus on For Your Performance Tests
App Performance KPIs
1. App Launch Time
Measures how quickly the app becomes usable after launch. A long startup time causes frustration, creates a poor first impression, and increases drop-offs.
Example: If a retail app takes 6 seconds to load during a sale event, users may abandon before the homepage even appears.
2. Response Time (UI Latency)
Time taken for the app to respond to user actions, such as tapping a button or loading a screen. Slow responses signal backend or API delays. Even slight lags create the feeling that the app is “slow.”
Example: A food-delivery app shows a spinning loader screen for over 8 seconds after “Place Order,” frustrating users and risking duplicate orders.
3. Error / Crash Rate
Percentage of failed transactions or app crashes during usage. High error rates directly affect reliability and user trust.
Example: A banking app that crashes when switching between savings and credit accounts can impact user trust
Network Performance KPIs
4. Network In Bytes
Amount of data received from the network during app activity. High inbound data usage can signal heavy content downloads or inefficient resource handling.
Example: When a shopping app loads a simple product page but downloads large image files in the background, it shows excessive network-in bytes usage.
5. Network Out Bytes
Amount of data sent out from the device to the network. High outbound usage often indicates unnecessary syncs, logging, or background uploads.
Example: When a social app keeps uploading logs even when the user isn’t active, it shows high network-out bytes consumption.
6. Packet Loss
Percentage of data packets lost during transmission. Packet loss leads to frozen screens, broken streams, and incomplete actions.
Example: A video-calling app showing frozen frames when a user switches from Wi-Fi to 4G indicates packet loss during the transition.
7. Throughput
Amount of data transferred per second during app activity. Low throughput usually indicates network bottlenecks affecting performance.
Example: When a movie takes too long to download, even on good Wi-Fi, it shows low throughput; the network isn’t sending enough data per second.
8. Download Speed
The rate of data received from the network. Helpful in assessing app responsiveness under various conditions.
Example: When app updates take longer on 4G compared to Wi-Fi, monitoring download speed confirms whether the issue is bandwidth-related.
Device Performance KPIs
9. CPU Usage
Tracks how much processing power the app consumes on a device. High CPU usage causes lag and overheating during longer sessions.
Example: A gaming app that heats up phones after 10 minutes of play suggests excessive CPU draw from unoptimized graphics.
10. Memory (RAM) Consumption
Shows how much memory the app uses while running. Poor memory management leads to app crashes and sluggish performance.
Example: A photo-editing app that crashes after applying multiple filters.
11. Battery Drain Rate
Measures the battery consumption caused by the app. Apps that drain battery fast are often uninstalled by users.
Example: When your phone battery drains fast after using a social media app for a few minutes, it signals high battery consumption.
How the HeadSpin Platform Helps Leverage These KPIs
The HeadSpin Platform is built to enable teams to track, analyze, and act on the App, Network, and Device Performance KPIs we discussed. Here’s how it supports them:
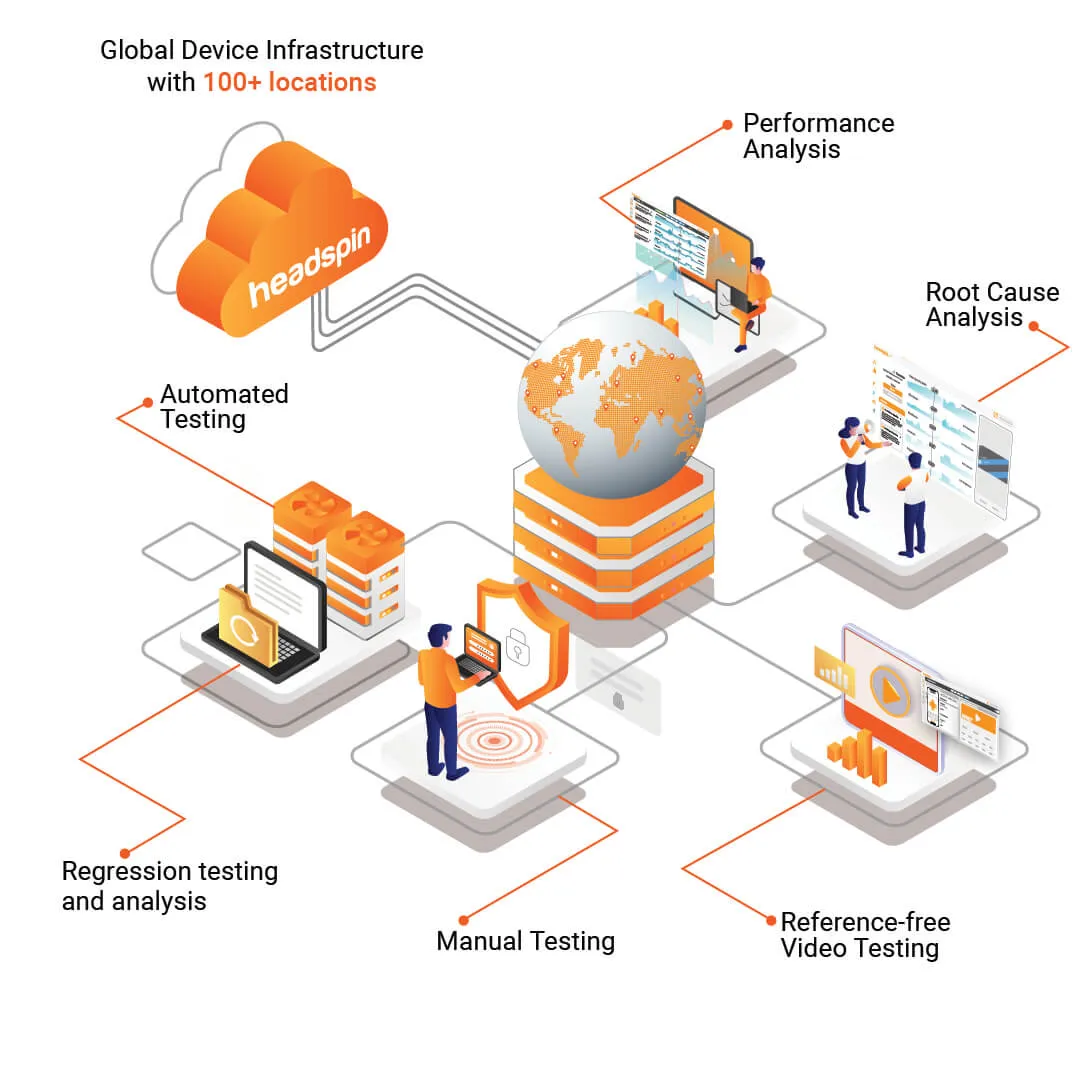
- Unmatched KPI tracking: HeadSpin captures 130+ built-in app, network, and device performance KPIs. You’re not limited to a fixed set of metrics with HeadSpin. The platform allows teams to define custom KPIs that align with their specific business or technical goals. For example, “max_current” to measure the peak electrical current drawn by a device during app usage. After each test, you can view selected KPIs in a Waterfall UI for a second-by-second, granular analysis.
- Issue Cards: The HeadSpin Platform leverages AI-powered analytics to give you actionable insights through issue cards. These cards help you identify problem areas in your app and highlight ways to improve them.
- Robust Regression Monitoring: HeadSpin leverages automation to continuously monitor app functionality and performance. With HeadSpin, you can monitor build-over-build regressions. You can set alerts to track app performance and receive notifications when the app exceeds defined thresholds.
- Performance Visualization via Grafana: HeadSpin leverages Grafana dashboards to provide a detailed view of your performance tests. You can visualize exact areas of performance degradation and accordingly plan next steps.
- Real Devices and Real Networks: For accuracy in real-world conditions, HeadSpin provides testing on real devices and networks (SIM-enabled, global coverage).
Bringing It All Together
Tracking performance KPIs isn’t just about collecting data. It’s about finding the real causes behind slow screens, crashes, and inconsistent user experiences. By monitoring metrics across app, network, and device layers, teams can see exactly where performance drops — whether it’s a backend API delay, a memory leak, or a weak network condition.
The HeadSpin Platform simplifies this by capturing 130+ KPIs, offering global real-device access, and helping teams turn numbers into insights that improve performance with every release.
Conclusion
Performance testing only works when it’s driven by the right metrics. The KPIs you track tell the story of how your app truly performs for users, not just in controlled test labs but in the real world. With HeadSpin, those insights become actionable, helping teams deliver faster, more reliable experiences across every device and network.
FAQs
Q1. Why is tracking performance KPIs important for apps and networks?
Ans: Tracking KPIs helps identify precisely where and why an app slows down, crashes, or consumes excess resources. By measuring these indicators, teams can detect performance bottlenecks early, optimize code, and ensure a consistent user experience across devices and networks.
Q2. At what stage should we start measuring performance KPIs?
Ans: Ideally, performance KPIs should be tracked continuously, starting in early development and throughout CI/CD pipelines. This helps teams spot regressions before production and maintain consistent app quality after every update.
Q3. How do we decide which KPIs to prioritize for our application?
Ans: The right KPIs depend on your app’s purpose and user flows. For example, a streaming platform might focus on throughput and latency, while a mobile banking app would emphasize response time and transaction success rate. The goal is to measure what directly affects user experience and business outcomes.


.png)


-1280X720-Final-2.jpg)


