AI-Powered Key Takeaways
Digital-native apps live or die by how they feel to users. Fast, fluid, responsive, reliable - that’s the baseline expectation now. A slow screen, an app that overheats a phone or drains the battery in an hour, or a crash because memory spikes are real quality problems. They kill engagement, ratings, retention, and trust.
Underlying all of that are a few core resource metrics every team should be watching: battery usage, CPU usage, and memory consumption. These aren’t just technical counters in a dashboard; they’re signals of how your app behaves in the real world under real pressure.
App Performance Monitoring Isn’t Optional
Measuring app performance is cirital to ensuring a smooth app experience. App performance monitoring gives you visibility into your app performance by helping you measure how your app is using device resources as users interact with it. Without it, you’re guessing at issues instead of discovering them through data. The goal isn’t perfection, it’s predictability and consistency - fast load times, smooth interactions, minimal drains on device resources. That’s what keeps users engaged and loyal.
When you consistently measure key metrics such as CPU cycles, memory allocation, and energy consumption, page load time, or throughput, it helps you measure the apps performance under these various metrics, helping you spot patterns early. You see slowdowns before users do, bottlenecks before they trigger crashes, and resource leaks before they tank sessions.
Why Battery Monitoring Matters
Mobile devices are battery-powered, users need things done quickly, and phone life matters. An app that aggressively drains battery will get uninstalled quickly.
Think about a digital-native food delivery app. A user opens the app during lunch, browses restaurants, checks reviews, and tracks their order in real time. Everything looks fine functionally. Orders go through. Maps load. Notifications arrive.
But after a few days, users notice something else. Their phone battery drops sharply whenever they use the app, even when it’s sitting idle in the background.
Battery monitoring helps you answer basic questions:
- Is the app doing heavy work at inappropriate times?
- Are background processes draining battery during idle periods?
- Does a new feature spike energy use for marginal benefit?
Tracking battery performance lets you dial back unnecessary work, batch processes more intelligently, or defer non-critical tasks until the device is active and charging. You directly improve user perceptions of app efficiency.
CPU Usage Optimization in Apps
CPU usage optimization is critical because the processor is the heart of your app. High CPU use isn’t just a performance cost; it also contributes to heat, battery drain, and a sluggish interface.
Imagine a digital-native social media app rolling out a new video feed feature. On high-end devices, everything feels smooth. On mid-range phones, users start reporting laggy scrolling, delayed taps, and overheating.
Effective CPU monitoring lets you:
- Detect code paths that consume disproportionate processor time
- Identify views or flows that cause spikes under load
- Prioritize optimization where it matters most
Without visibility into CPU load, you can optimize UI or backend logic all you want, but miss the real bottlenecks that degrade user experience across devices and OS versions.
Memory Consumption in Mobile Apps
Memory is finite, and mobile devices juggle dozens of apps in the foreground and background. If your app hoards memory or leaks it over time, you’ll see slowdowns, cache collection, and eventually crashes.
Consider a digital-native fintech app that users keep open for long sessions while reviewing transactions, switching accounts, and scanning statements.
Monitoring memory consumption in mobile apps lets you:
- Spot leaks before they affect sessions
- Understand allocation patterns under real user interactions
- Improve app stability across device classes
Memory issues aren’t always apparent in short tests. They build up over time and under real usage. That’s why continuous monitoring is robust; it shows trends you otherwise wouldn’t catch until a user reports a crash.
How Real-World Monitoring Changes the Game
The best performance strategies combine real usage data with automated alerts and dashboards. Tracking these metrics over time gives you context on how different network conditions, devices, and OS versions affect resource usage, and whether changes you ship improve or regress quality.
Platforms that offer real device visibility make this practical. They show you what’s happening on actual handsets, not emulators, giving you accurate CPU, memory, and battery data under real conditions. That’s the difference between theoretical performance and real user experience.
What This Really Means for Your Digital Native App
Monitoring CPU, memory, and battery isn’t just about avoiding crashes. It’s about how your app feels after 10 minutes of use with 15% battery left. It’s about making sure a checkout flow doesn’t heat a phone, a video feed doesn’t stutter mid-scroll, and a long session doesn’t quietly push the app toward a crash.
Teams that embrace app performance monitoring as a core practice ship better products, reduce churn, and build user confidence. That’s what quality feels like.
How HeadSpin Helps Digital-Native Apps Test Performance
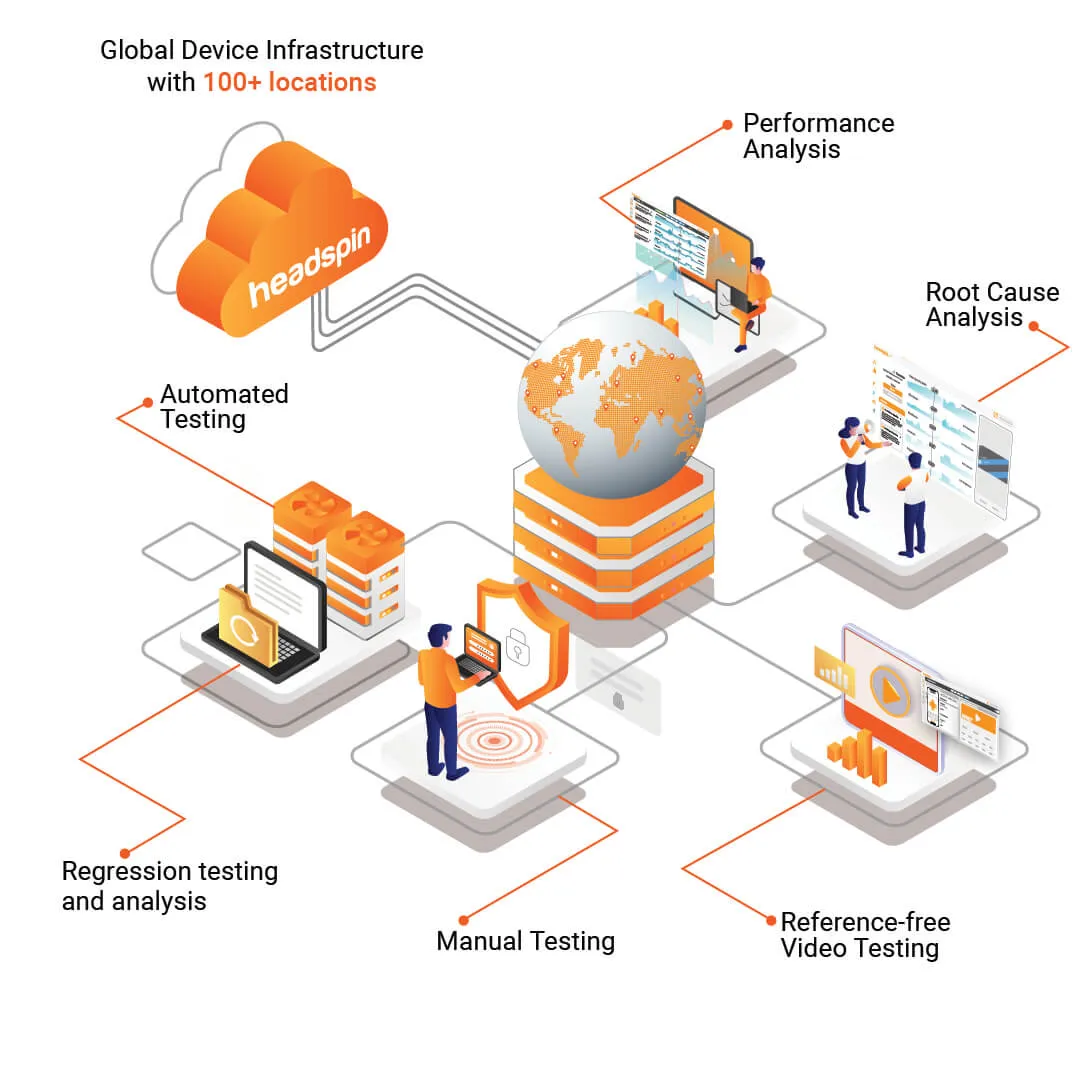
HeadSpin gives teams real device data and tools to track resource usage under real-world conditions, not just in the lab. With HeadSpin, you can:
- Run tests on thousands of real devices across networks and geographies to capture real app performance monitoring signals, such as CPU load, memory, and battery drain, in true user environments.
- Collect detailed KPIs, over 130 metrics, to analyze app, device, and network performance with fine granularity.
- Use dashboards and automated actionable insights to quickly spot anomalies and root causes, making it easier to fix resource issues before release.
- Compare builds, networks, and locations to catch regressions or hotspots tied to CPU, memory, or battery.
- Monitor user flows after release, tracking KPIs like CPU, memory, battery usage, and pass–fail trends through HeadSpin’s performance monitoring dashboards.
Instead of waiting for users to complain, you see how resource usage trends change over time and act before performance becomes a support headache.
Conclusion
Monitoring battery, CPU, and memory isn’t a checkbox. It’s about ensuring users have fast, stable, and efficient experiences that keep them coming back.
If you want to move from reactive fixes to proactive performance improvements, start tracking the right metrics and build them into your test and release process. Tools like HeadSpin provide real-world visibility into resource usage so that you can optimize with confidence.
FAQs
Q1. Why is mobile resource monitoring different from general performance monitoring?
Ans: Mobile resource monitoring focuses on device-specific signals such as battery usage, CPU load, and memory usage patterns. These directly impact user perception on real devices, which general backend metrics don’t always capture.
Q2. How often should I track CPU and memory usage during development?
Ans: Track these metrics continuously during functional and regression tests. You can also monitor production builds KPIs post-release. Unexpected spikes can show up only under specific interactions or prolonged use.
Q3. Can resource issues be caught in emulators?
Ans: Emulators help with early testing, but they don’t reflect real hardware constraints. Real devices help capture actual CPU behavior, memory limits, and battery impact.


.png)


.png)


-1280X720-Final-2.jpg)


