AI-Powered Key Takeaways
What is Application Monitoring?
Application monitoring is the process of collecting, tracking, and analysing the performance, availability, and user experience of your software applications.
Here’s what this means in practice:
- You want to know whether a key user transaction (like a checkout or login) is working, how long it takes, and whether it’s failing for some users.
- You want to detect anomalies (such as slowness, errors, or resource saturation) early, before users start complaining or abandoning your app.
- You want to understand the underlying components (APIs, services, database, network) that contribute to problems. Not just “the app is slow” but “this service call is the bottleneck”.
Why is it Important For Organizations
- User experience & retention: A slow or unavailable app frustrates users and drives them away. Monitoring gives you early warning.
- Business impact: Every minute of downtime or degraded performance can translate into lost revenue, brand damage, or SLA penalties.
- Operational efficiency: With proper monitoring, you reduce the time to detect (MTTD) and time to resolve (MTTR) issues, freeing your teams to innovate instead of firefighting.
- Managing complexity: Modern apps run in distributed, containerized, microservices architectures with cloud, edge, mobile, and browser layers. Traditional monitoring won’t suffice; you need something application-aware.
- Data-driven decisions: Monitoring isn’t just reactive; it provides the metrics and signals you need to plan capacity, optimize performance, and align with business goals.
Top 5 Application Monitoring Tools
1. SigNoz
What it is:
SigNoz is a full-stack open-source observability platform built for modern applications. It combines metrics, traces, and logs into one UI and runs on top of OpenTelemetry, the open standard for telemetry data collection.
Key Features
- Unified observability: view metrics, traces, and logs in a single console.
- Real-time performance metrics for microservices, APIs, and databases.
- Easy to deploy using Docker or Kubernetes.
- Detailed service dependency maps and latency analysis.
Limitations
- Users in community forums report issues such as sluggish log queries, less mature dashboard/alert setup workflows, and limited built-in SSO/RBAC in earlier versions.
2. Prometheus
What it is:
Prometheus is the backbone of cloud-native monitoring. It’s a metrics-focused monitoring and alerting toolkit that works seamlessly with Kubernetes, Docker, and Grafana.
Key Features
- Multi-dimensional data model with PromQL query language.
- Efficient time-series database designed for scale.
- Flexible alerting through Alertmanager.
- Integrates with Grafana for visualization.
Limitations
- Prometheus itself only handles metrics. It is “not a full-stack application monitoring tool” and needs separate tools for logs and traces.
- Even dashboards are minimal: Prometheus’ own UI is basic, and most teams bolt on Grafana for real visualization.
3. Elastic APM
What it is:
Part of the Elastic Stack (ELK), Elastic APM lets you trace requests, monitor database queries, and visualize performance—all while using the same Elasticsearch engine that powers logs and metrics.
Key Features
- Distributed tracing and transaction tracking.
- Tight integration with Elasticsearch, Logstash, and Kibana.
- Agent support for Java, Python, Node.js, Go, and more.
- Real-time analytics for user experience and error detection.
Limitations
- Running ELK/Elastic Stack is known to be complex: you’re managing Elasticsearch clusters, Kibana, APM Server, Beats/agents, indices, lifecycle policies, etc. Multiple analyses explicitly call out the ELK stack’s complexity and “steep learning curve.”
- User reviews for Elastic Observability mention difficulty onboarding and that advanced features require training to use effectively.
4. Jaeger
What it is:
Originally developed at Uber and now a CNCF-graduated project, Jaeger specializes in distributed tracing. It helps developers visualize request paths and diagnose performance issues across complex microservices.
Key Features
- Visualize service dependencies and request flows.
- Measure latency and identify slow components.
- Integrates with OpenTelemetry for consistent instrumentation.
- Storage backends include Elasticsearch, Cassandra, and Kafka.
Limitations
- Jaeger “does not support logs or metrics” and is limited to processing and querying spans and traces.
- That means you must pair it with other systems for metrics, logs, dashboards, and alerting to achieve full observability.
5. Apache SkyWalking
What it is:
SkyWalking is an Apache Software Foundation project offering end-to-end observability for microservices, cloud-native, and serverless applications. It provides metrics, logs, and traces in one unified platform.
Key Features
- Automatic instrumentation for multiple languages.
- Service topology and performance analysis.
- Supports metrics aggregation and log correlation.
- Integration with Kubernetes and service mesh (Istio, Envoy).
Limitations
- SkyWalking’s load-balancing methods require the app (client) to handle dropped connections and request retries. If the client isn’t built for this, things can break.
- When a proxy disconnects or stops accepting new connections, the client must retry the data. If it doesn’t retry correctly, some data may be lost.
Open-source tools generally require self-hosting, which requires more effort in management. In such cases, relying on a premium tool like HeadSpin saves you the trouble of self-hosting. HeadSpin hosts and manages all devices so you can focus on monitoring.
Lets See How HeadSpin Helps With Application Monitoring
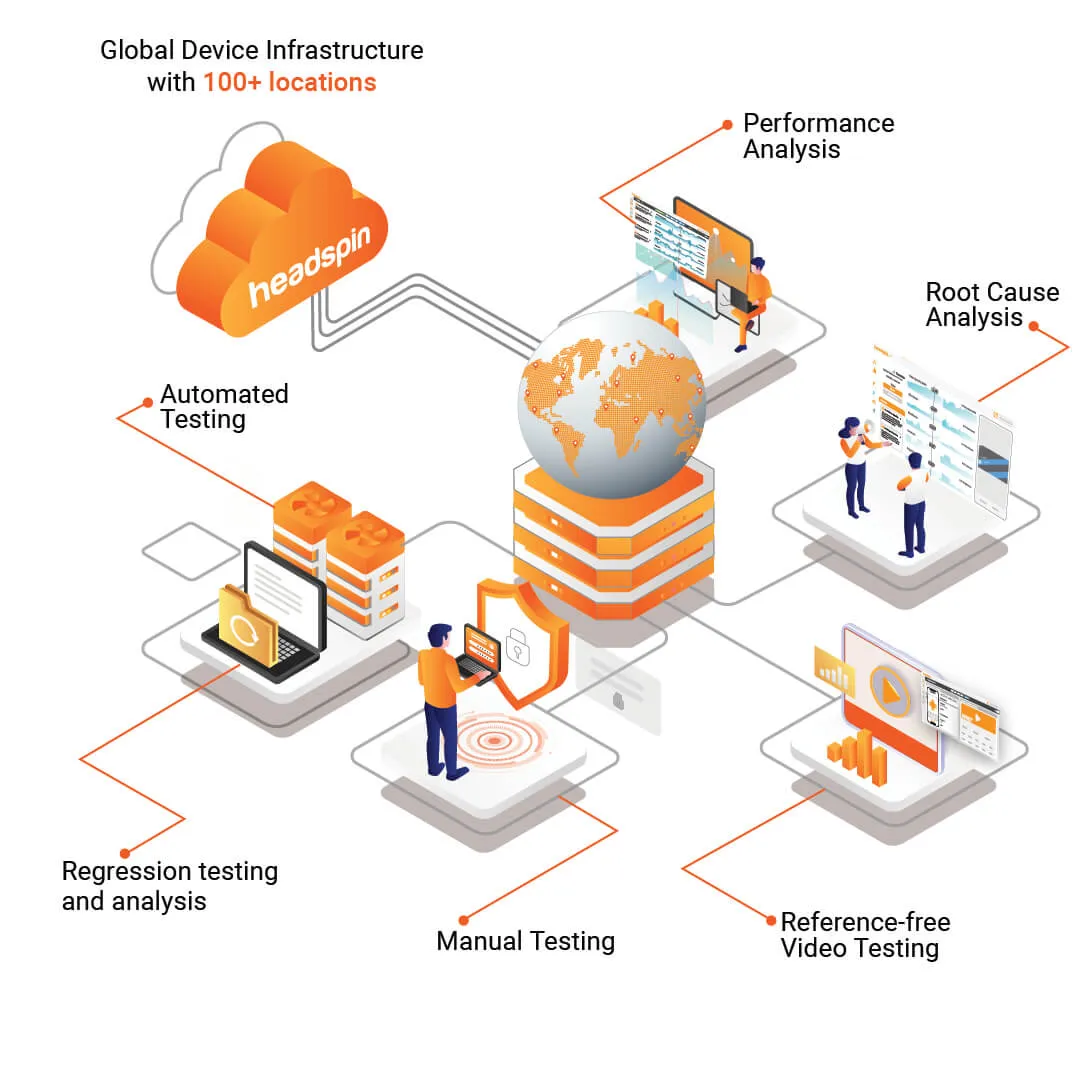
While the tools above focus on backend observability, infrastructure monitoring, and distributed tracing, they still leave a gap: how the app actually performs on real devices, real networks, and real user conditions. That’s where HeadSpin fits in.
HeadSpin doesn’t replace these tools. It strengthens everything they do by giving you visibility into what your users actually experience.
Here’s how:
- Removes operational complexity with a fully managed platform, eliminating the overhead of configuring clusters, managing pipelines, or maintaining multi-component observability stacks.
- Covers global real-world conditions, including multiple geographies, SIM-enabled real mobile devices, browsers, and various network conditions. Suitable for apps with a global reach and variable network conditions.
- Provides complete performance context through unified session data, device metrics, network traces, and visual timelines, addressing the limitations of tracing-only tools that lack logs, metrics, and user-side insight.
- Delivers fast, device-level analytics and mature alerting workflows through AI-driven insights, pre-built dashboards, and real-time KPI thresholds, removing the need to depend on slow log queries or immature alert setups.
- Ensures reliable data collection under real-world network and device conditions without requiring the app or client to handle retries or dropped connections, preventing telemetry gaps and data loss found in self-hosted or proxy-dependent setups.
- It integrates with Grafana and utilizes alert watchers, enabling your DevOps/QA teams to receive proactive notifications when a KPI exceeds a threshold or performance regresses.
Final Thoughts
Application monitoring in 2026 is non-negotiable if you want your applications to perform, scale, and deliver the user experience your customers expect. Running open-source tools provides flexibility, control, and cost efficiency.
However, you also need to ensure that you’re capturing the whole picture, not just service-health metrics, but the experience on real devices, networks, and geographies. That’s where combining an open-source monitoring stack with a platform like HeadSpin gives you the best of both worlds.
FAQs
Q1. Why is application monitoring vital for modern, cloud-native, or microservices-based applications?
Ans: Because modern applications span containers, serverless, mobile, and global networks, visibility becomes fragmented. Without monitoring, you risk degraded user experience, slow root-cause resolution, and business impact.
Q2. What is application monitoring, and how does it differ from system or infrastructure monitoring?
Ans: Application monitoring is the process of tracking an application’s performance, availability, and user experience across its front-end, mid-tier, and back-end components. It differs from traditional infrastructure monitoring in that the focus is on the application logic, user transactions, and business flows, not just server CPU, memory, or network.


.png)


.png)


-1280X720-Final-2.jpg)


