


UI Master Guide
Navigating the HeadSpin Platform
You signed up for HeadSpin so that you can test, debug, and gather data for your apps as quickly and efficiently as possible--and we want to help! To that end, this guide exists to help you become familiar with the layout of the HeadSpin UI and give you a high-level understanding of the tools at your disposal within our platform.
LOGIN
The HeadSpin portal functions through our remote cloud network. To access the platform, navigate to the HeadSpin URL and log in to your account.
User Login Panel
Welcome to the HeadSpin platform! After logging into the portal, the Remote Control page will be the first thing you see. Before getting into the major sections of the platform interface, there is something we want to cover first: the User Login panel accessed from the top-right corner of the screen and its associated links. This panel will appear on any page of the HeadSpin platform. We’ll also cover the Navigation Bar to the left of your screen before diving deeper into each of the HeadSpin interface pages.
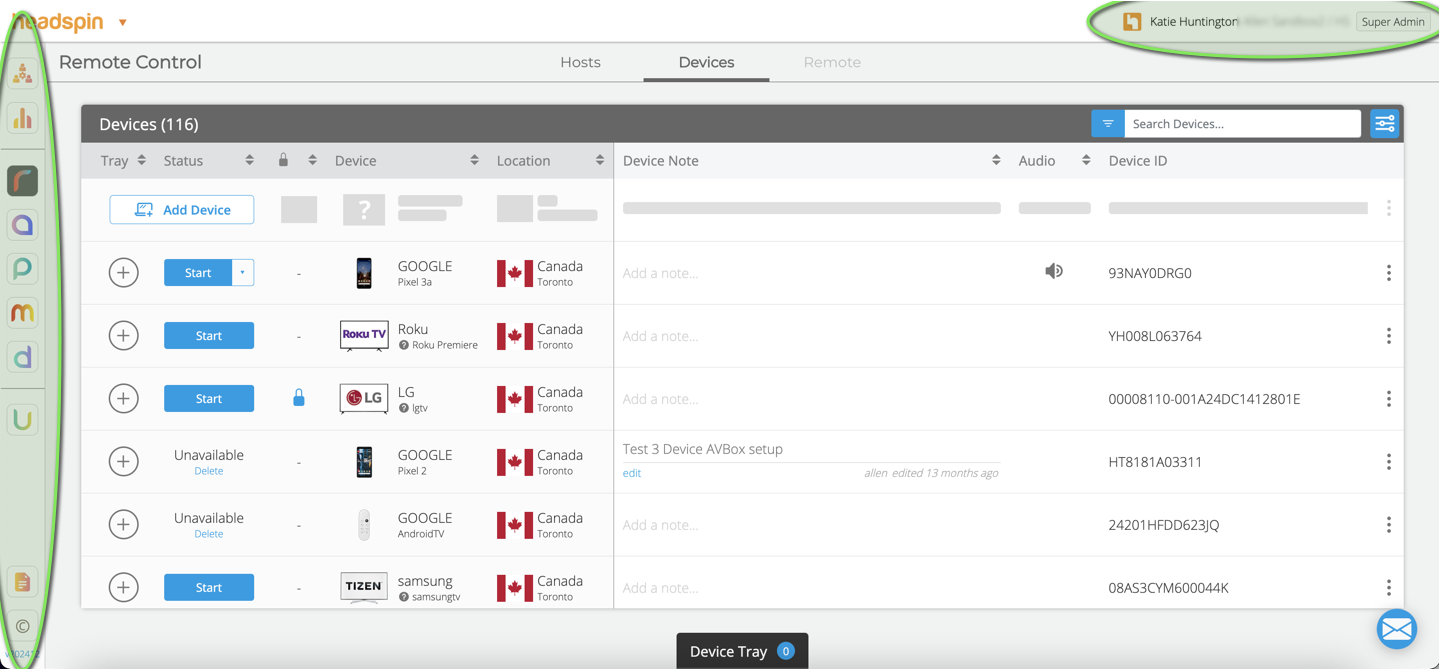
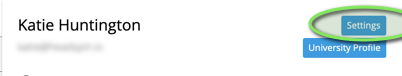
In the upper-right corner, your username, the org your account is associated with, and your role will be displayed. The User Login panel appears on the right side of the screen once you click on your name.
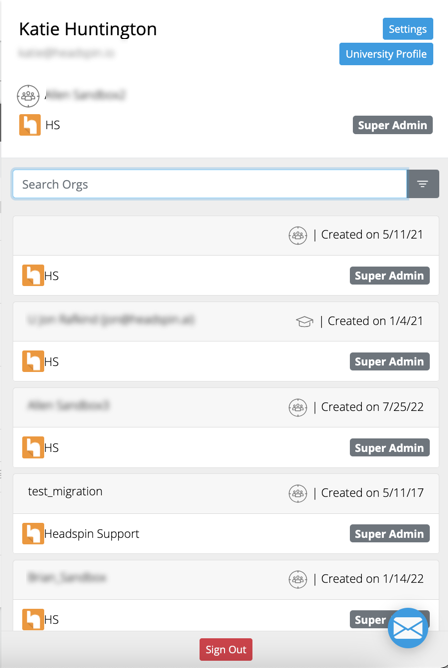
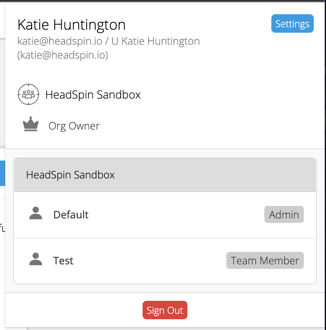
The User Login panel displays some basic user information, such as your account's email address and the HeadSpin client organizations with which your account is associated. If you have access to multiple organizations, you can search for a particular organization within the ‘Search Orgs…’ search bar. To log out of your current account, click the red ‘Sign Out’ button at the bottom of the panel. Typically, customers will only need access to an Enterprise/default account, which looks like this:
However, if your organization should need an additional org account, please feel free to contact HeadSpin for further discussion.
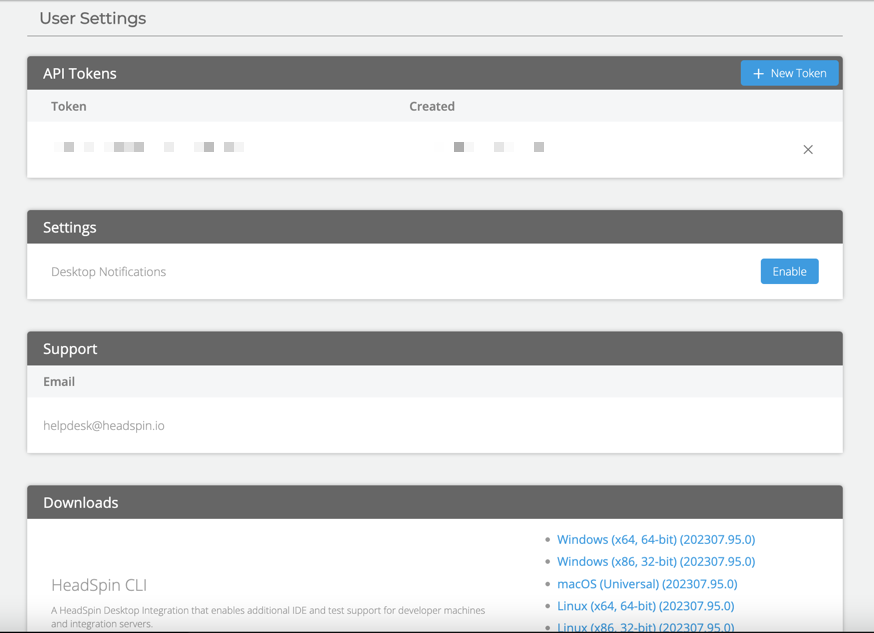
From the User Login panel, you can navigate to user settings by clicking the blue ‘Settings’ button at the top of the panel.
Nav Bar
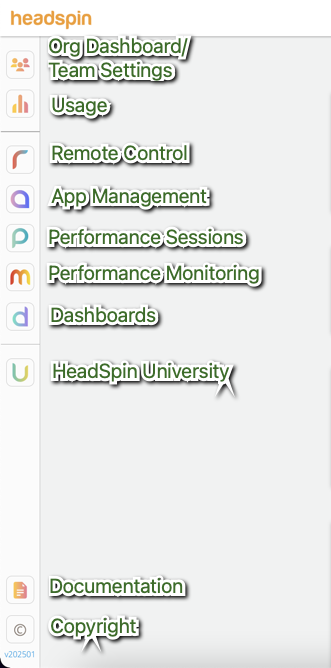
The Navigation Bar, or Nav Bar, contains shortcut links in the form of icons that will take you to different parts of the HeadSpin UI. From top to bottom, those links are:
- Org Dashboard/Team Settings
- Usage
- Remote Control
- App Management
- Performance Sessions
- Performance Monitoring
- Dashboards (optional)
- HeadSpin University
- Documentation
- Copyright
Let’s take a closer look at each of these areas of the HeadSpin platform.
ADMINISTRATIVE PAGES - Org Dashboard and Usage Page
The first two icons in the Nav Bar will take you to the Org Dashboard/Team Settings page and Usage page respectively.
Org Dashboard/Team Settings
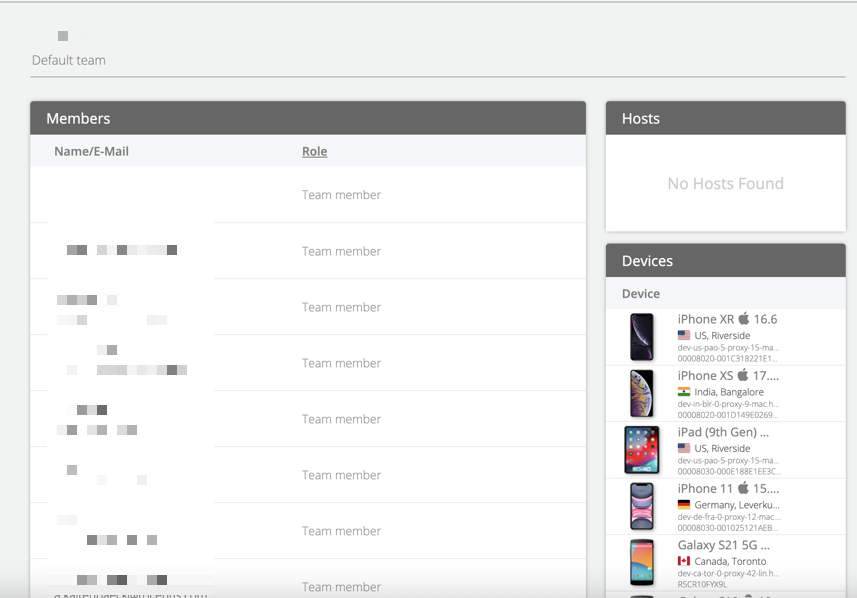
On the Org Dashboard page, a user with the Org Owner role can view information regarding how the company’s HeadSpin user accounts and user groups are organized; if you are not an Org Owner (meaning you have an Admin or Team Member role), this icon navigates to the Team Settings page instead. For non-Org Owner accounts, this page will only display information for your assigned team.
For organization owner accounts, the Team Settings icon changes to the Org Dashboard icon (note the change in the screenshot below). Org Dashboard has the following tabs for navigation displayed at the top of the page:
- Teams: View information about all teams/user groups for this org.
- Users: View information regarding all user accounts in this org.
- Owners: View information for your org owner account(s).
- Hosts: View information regarding host machines assigned to this org and their locations.
- Devices: View all devices listed for your organization and associated details.
- SSO: View and modify settings for your SSO configuration, including OAuth and SAML.
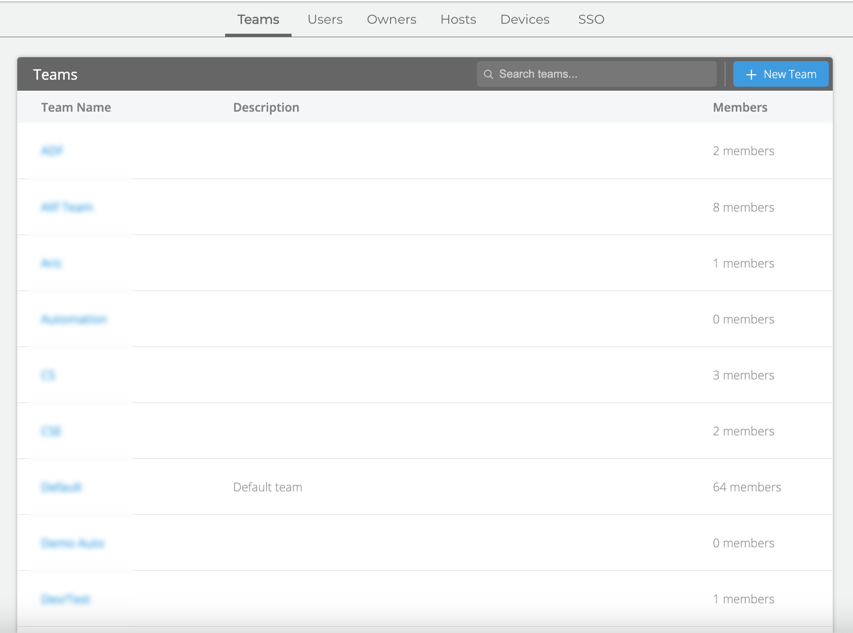
The Teams, Users, and Owners tabs also contain the option to create a new instance of the item with which that tab is associated; for example, the Teams tab allows you to create a new team, and the Owners tab allows you to create a new Org Owner. Each tab (with the exception of SSO) has a search bar that will allow you to search the contents of your org for a specific item (such as a particular user account or device).
Usage
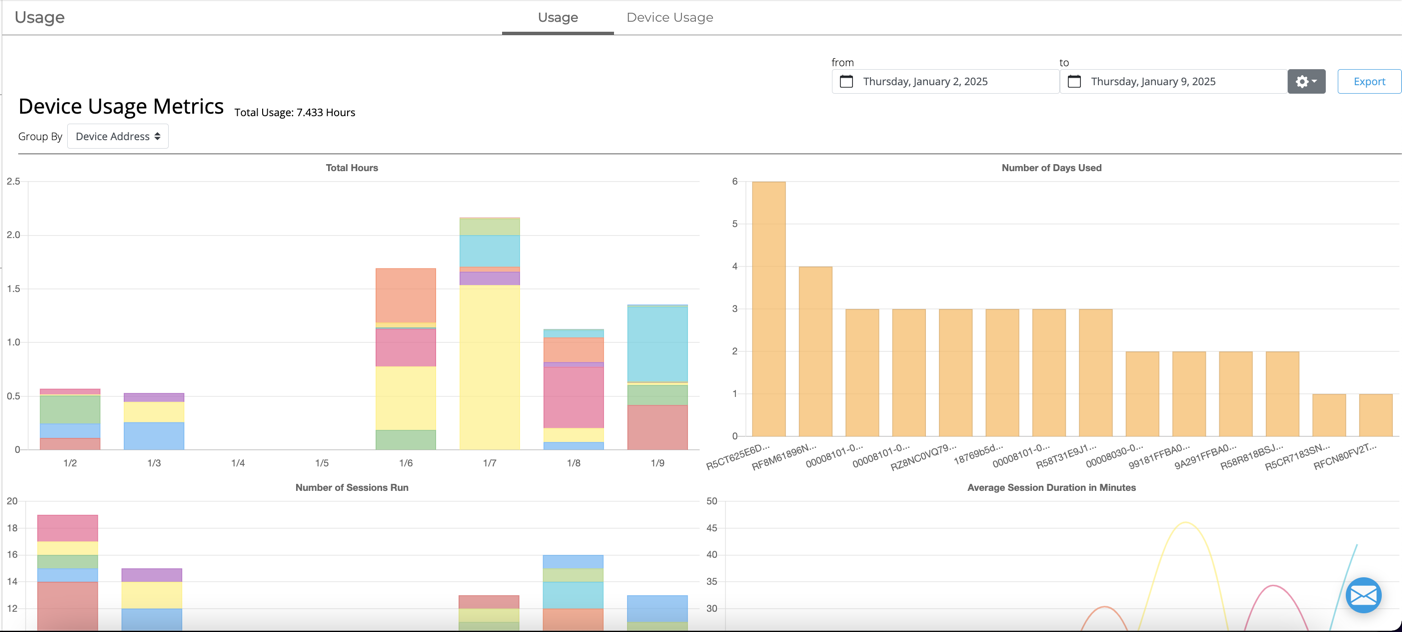
The Usage icon takes you to the Usage page, which displays your device usage metrics. The Usage tab displays a collection of graphs detailing your organization’s device usage metrics. There are graphs measuring usage in terms of total hours, number of days or number of sessions, average duration of sessions, and more. You can also modify the window of time these graphs measure; the default settings display usage over the course of the last 30 days (ending with the current date), but you can change these dates to reflect the time you would like to review. The Export button exports your usage metrics data as a .csv file.
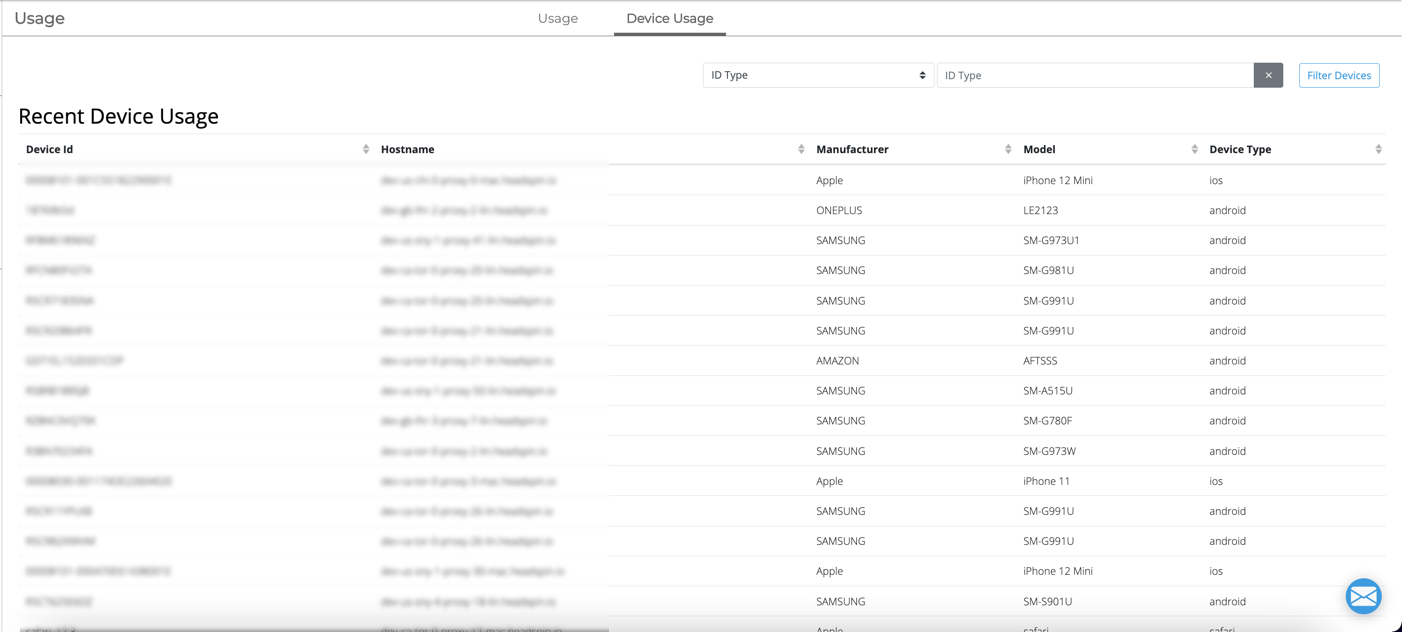
The Device Usage tab of the Usage page displays recent device usage data in something more like a list format. Devices will be listed by Device ID, but can also be arranged according to hostname, manufacturer, model, or device type; the default list of these recently used devices is ordered chronologically. You can filter the device list by ID types not included in these default categories (such as user ID of the tester account) or search for a specific ID to view usage data for a specific device.
TESTING PAGES
The five icons in the middle of the Nav Bar will take you to the pages within the HeadSpin UI that handle executing tests, retaining devices, and analyzing data. The first icon takes you to the Remote Control page; let's start there.
Remote Control
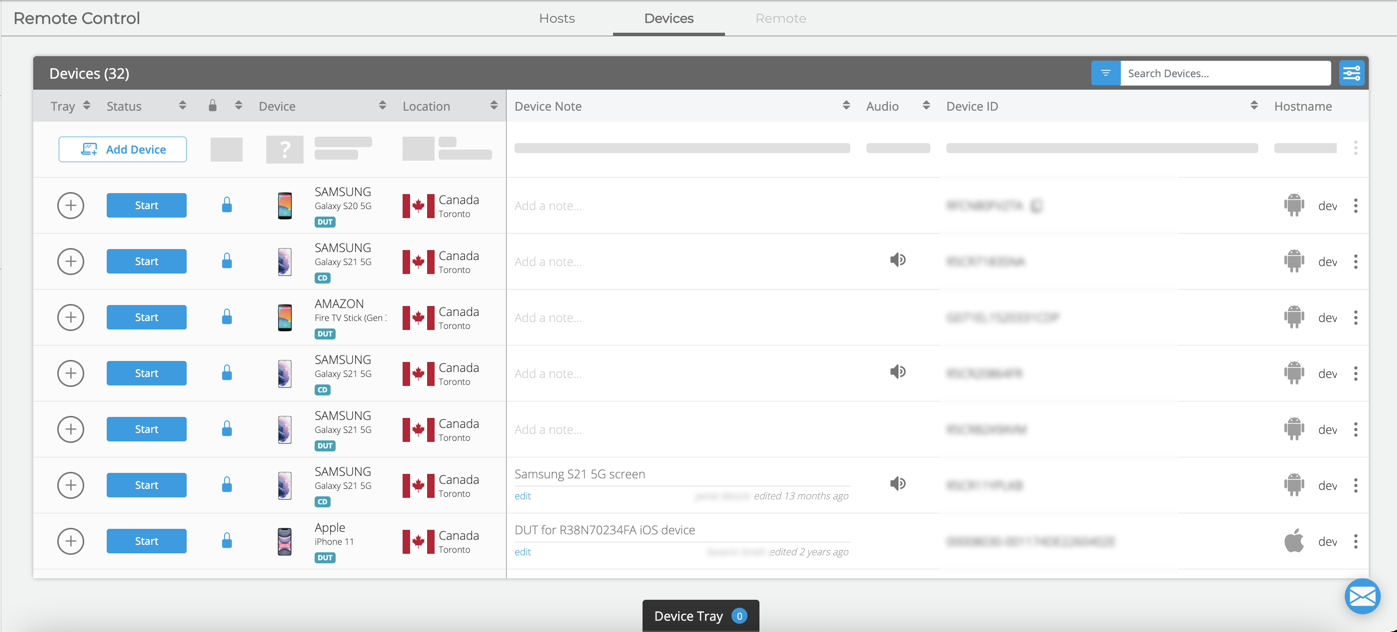
The Remote Control page is arguably where you will conduct the bulk of your testing activities. By default, the Remote Control page loads on the Devices tab, the second of three tabs. The three tabs found on this page are:
- Hosts: View info about the available host machines and their geographic locations.
- Devices: View a list of devices and their associated information, such as device status and ID.
- Remote: This tab will only activate once a session has been opened on a device. Once you open a session, this tab displays a live interactive view of the selected device and allows you to perform a manual test on that device.
Both the Hosts and Devices pages have search bars located near the top of the page to assist you in locating specific host or device machines. On the Devices page, you can add a new device to your device list. You can also choose how you want to launch a session on a device from your device list: clicking the ‘Start’ button will take you to the live device view in the Remote tab (what could be considered a standard session), while clicking the dropdown arrow beside the 'Start' button will give you the option to launch an Appium session on the device or edit the Appium capabilities assigned to that device.
As previously stated, the Remote tab will only become active when you have begun a session on a device. Once that is done, the Remote tab will display two panels. The panel on the left side of the page shows a live view of the device screen; this display is also interactive, receiving and responding to touch, swipe, and virtual keyboard prompts as a device in hand would do. The right panel contains several tools and settings options you can use during your test, including the capture of screenshots, logs, and automation configuration data. If you open an Appium session, rather than a standard manual one, the Remote tab will open as normal and include the same options as a standard session, but with the addition of the Appium Inspector integration panel. Using the Inspector you will be able to interact with the device using the various Appium-specific tools. (For more information on the Appium Inspector, click here.)

On any tab of the Remote Control page, you will see an icon at the bottom of the screen called ‘Device Tray’.
Clicking this button brings up the HeadSpin device tray, which shows any devices on which you have an active session, as well as any devices recently used in a session by the currently logged-in user. These can be used for reference in capturing multiple devices for automated tests. A device upon which a session is launched will automatically be added to your device tray; if you wish to add a particular device to your tray, click the ‘+’ button to the left of a device’s listing. To remove a device from your tray, you can click the 'Clear' button within the tray (this will remove all devices from the tray), click the ‘X’ button beneath a specific device within the tray, or find the device in the device list and click the ‘X’ icon to the left of the 'Start' button on the device’s listing. (The ‘+’ button transforms into the ‘X’ button once a device is in your tray.)
.png)
App Management
The App Management page provides a space for you to view all apps and app versions uploaded to your HeadSpin environment, as well as several search options to help you find the exact version you need when you need it. By default the App Management page lists all apps/versions in descending order from latest upload to oldest upload. The default number of builds displayed at a time is 20; in the bottom-left corner of the window, App Management will show how many builds are currently displayed out of your total uploaded builds (e.g. 20 out of 350.)
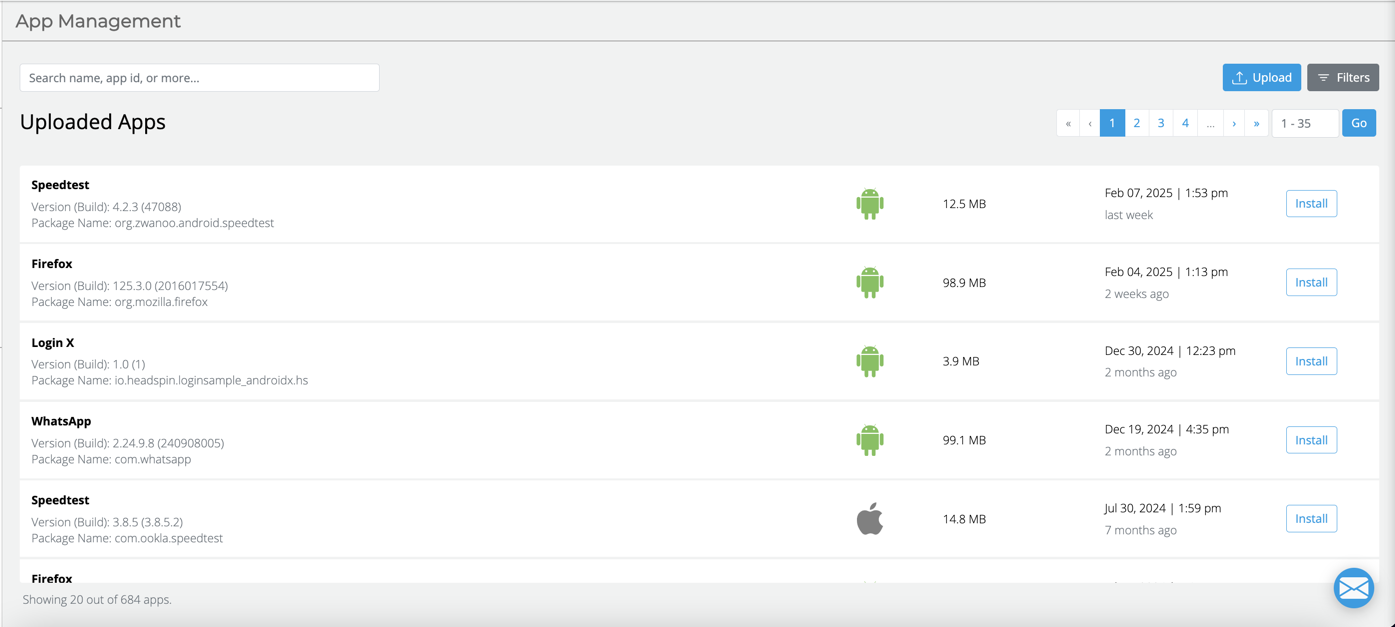
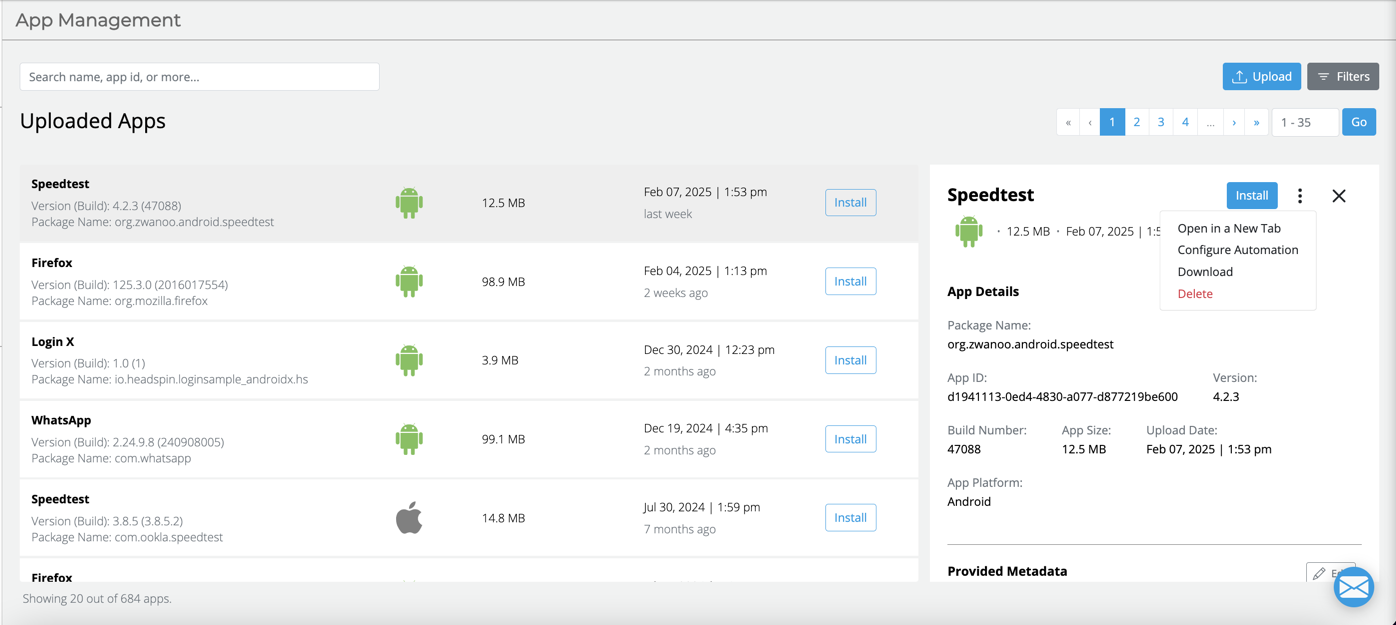
Each instance of a build upload is displayed as an individual item in the list; some basic descriptive info is displayed with every item in the overall list, such as version number, app name and supported manufacturer. Along with its general details, each item has an 'Install' button to its right, allowing you to easily install different versions through the UI. Clicking on a build will open a details panel to the right of the screen. This panel includes information such as the app ID, size, associated metadata, and other useful information. You can close this panel by clicking the 'X' icon in the upper-right area of the panel; clicking the vertical ellipsis icon ('...') offers further options for interacting with the build, like opening the details in a new tab of your browser or downloading the build to your local machine.
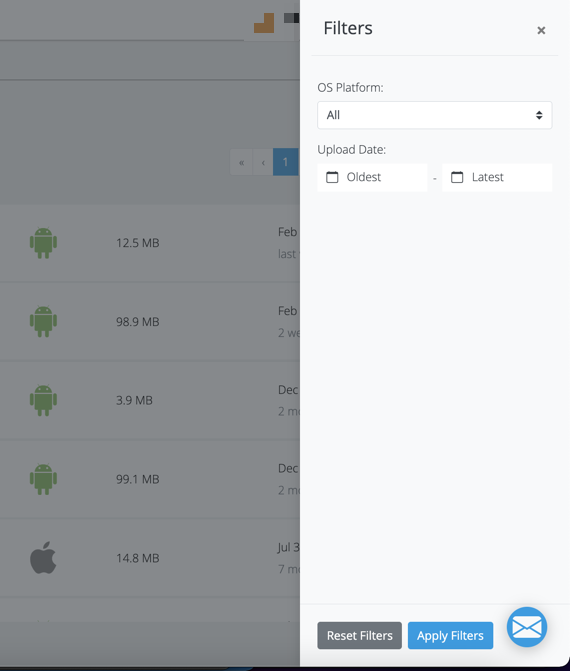
To locate a specific build, you can utilize the search bar at the upper-left corner of the page to find a version according to data input, such as searching by name or app ID. For a less precise search method, you can click through the navigational numbers in the upper-right corner of the page to go deeper into your app list, or type in a specific range of apps to be shown next to the 'Go' button. Alternatively, you can click the 'Filters' button to pull up a list of available search filters and narrow down your displayed apps; for example, you can search for apps designed only for iOS, or you can re-sort your versions by oldest upload date.
Performance Sessions
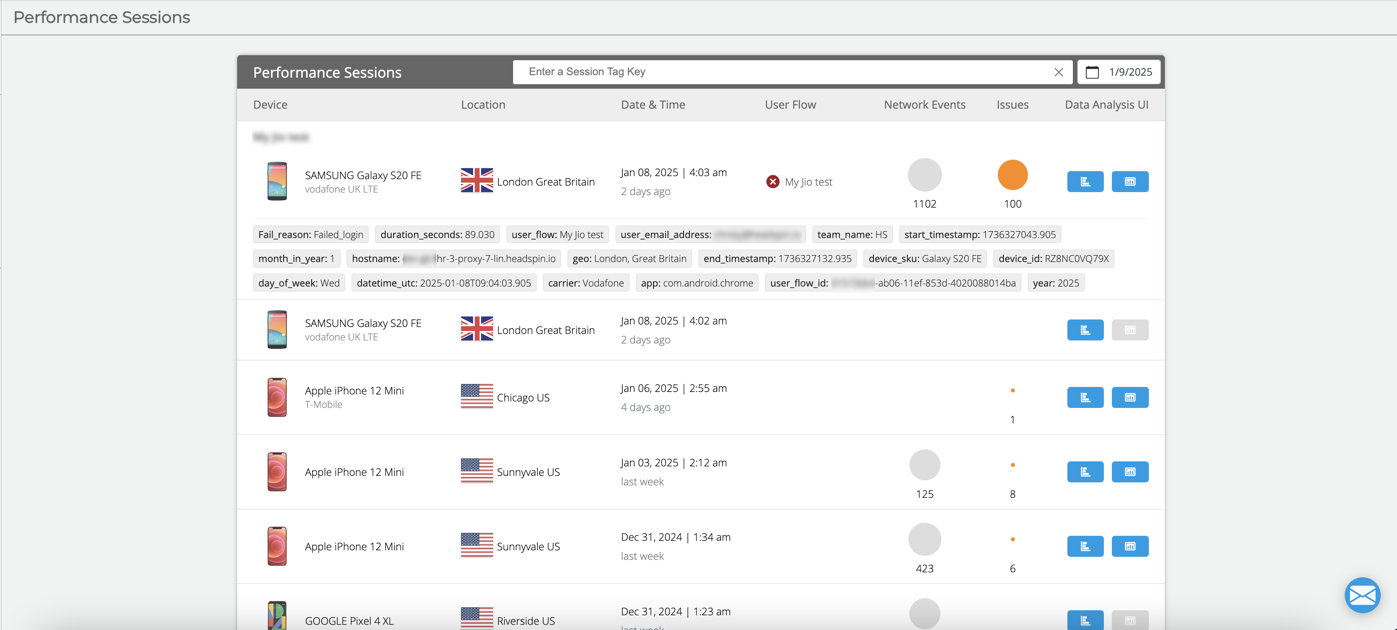
The Performance Sessions tab displays a list of sessions in chronological order, beginning with the most recent, and contains general information about each session in the list. This information includes the device model, its location/host machine, the start time of the session, any user flows applied during the session, and network events or issues detected during the session. (A user flow is an object specific to HeadSpin; it's a collection of sessions, typically grouped according to a user intention or test goal.) If any tags are assigned to a session, these are displayed as well; you can filter the displayed session list by tags in the ‘Filter sessions’ bar. Each session also offers the option (once it is completed) to view its data in Waterfall UI or Issue UI mode. Waterfall UI provides a comprehensive package of data captured during your session, including session-wide metrics, timeseries statistics and data, and detected issues listed according to impact time. Issue UI delivers data regarding network performance issues specifically. You can learn more in-depth information about Performance Sessions here.
Performance Monitoring
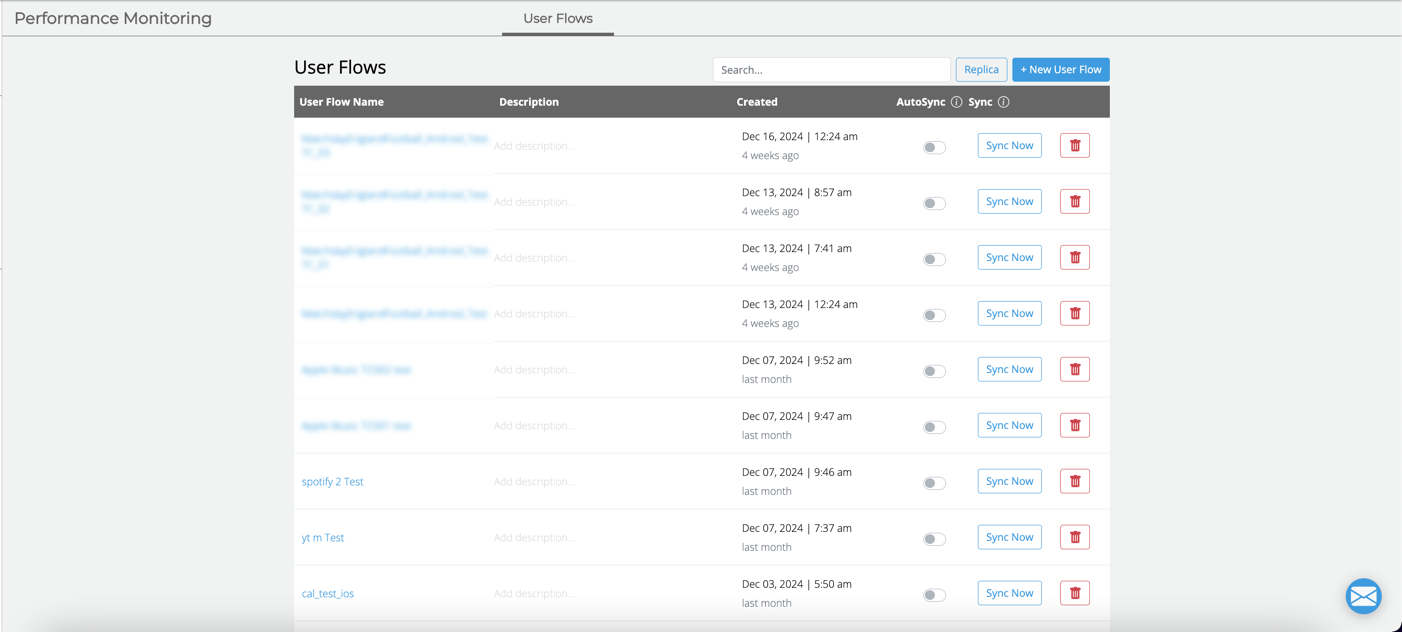
The Performance Monitoring tab displays information regarding your user flows; this page contains the majority of the data you will want to use in drawing conclusions from your testing and visualizes it for you. The Monitoring page informs you of each user flow’s name, description (if provided), and creation time. You can create a new user flow from this page, or you can review the details of a particular user flow by clicking on the flow’s hyperlinked name.
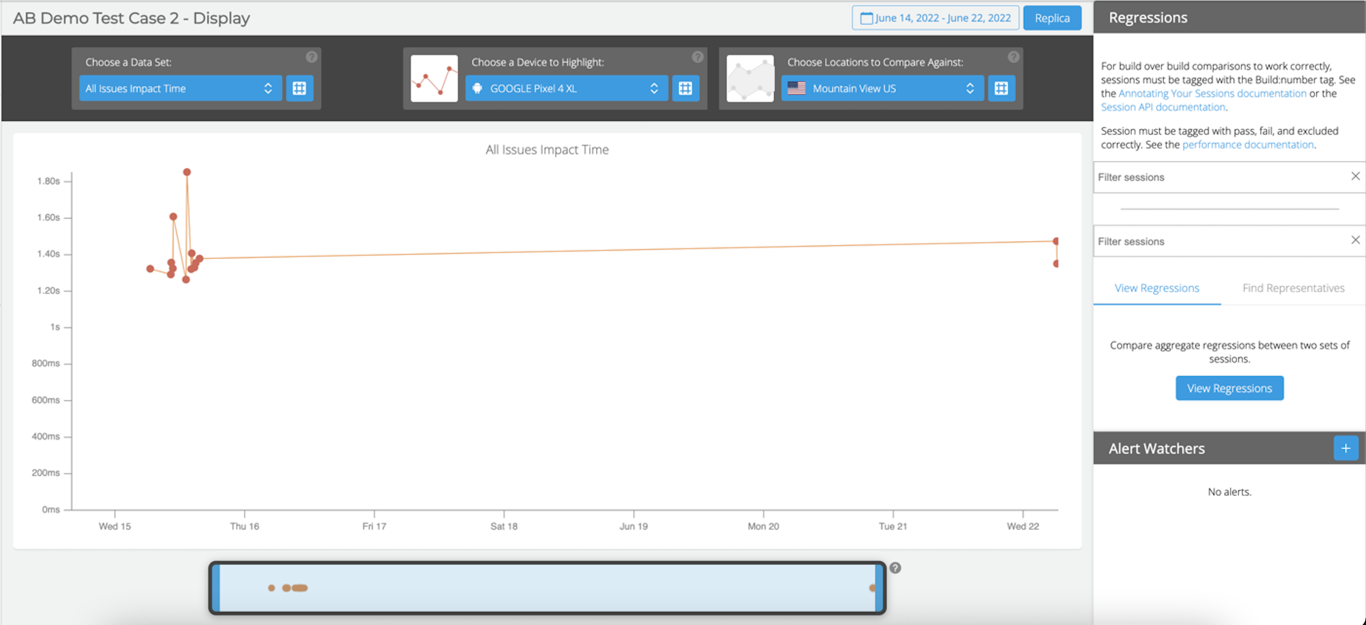
Upon clicking a user flow’s name, HeadSpin takes you to an interactive data page for that user flow, where you can select a data set, device, and locations for data comparison. For further interactive guidance, you can click the question mark icon that appears toward the bottom of the Nav Bar while on the Performance Monitoring page for additional information.
You can also interact with regressions for selected issues and review the associated Replica data for your chosen user flow. Replica databases allow you to create tables of custom queries to make your data even more specific to your use case; the tables allow you to create queries for sessions inside user flows as well as across user flows. Replica data can then be displayed in custom Replica Dashboards, described below.
Dashboards

The Dashboards page gives you the opportunity to set up and view helpful information at a glance for your more common testing queries or needs. HeadSpin uses Grafana to create these dashboard instances. HeadSpin can automatically provision a Grafana account that will link to the Replica database with exported user flows and custom query tables, which can then be used to create unique dashboards. These custom data collections will better assist you in monitoring various KPIs and simplifying the collection and synthesis of other business intelligence.
HeadSpin University
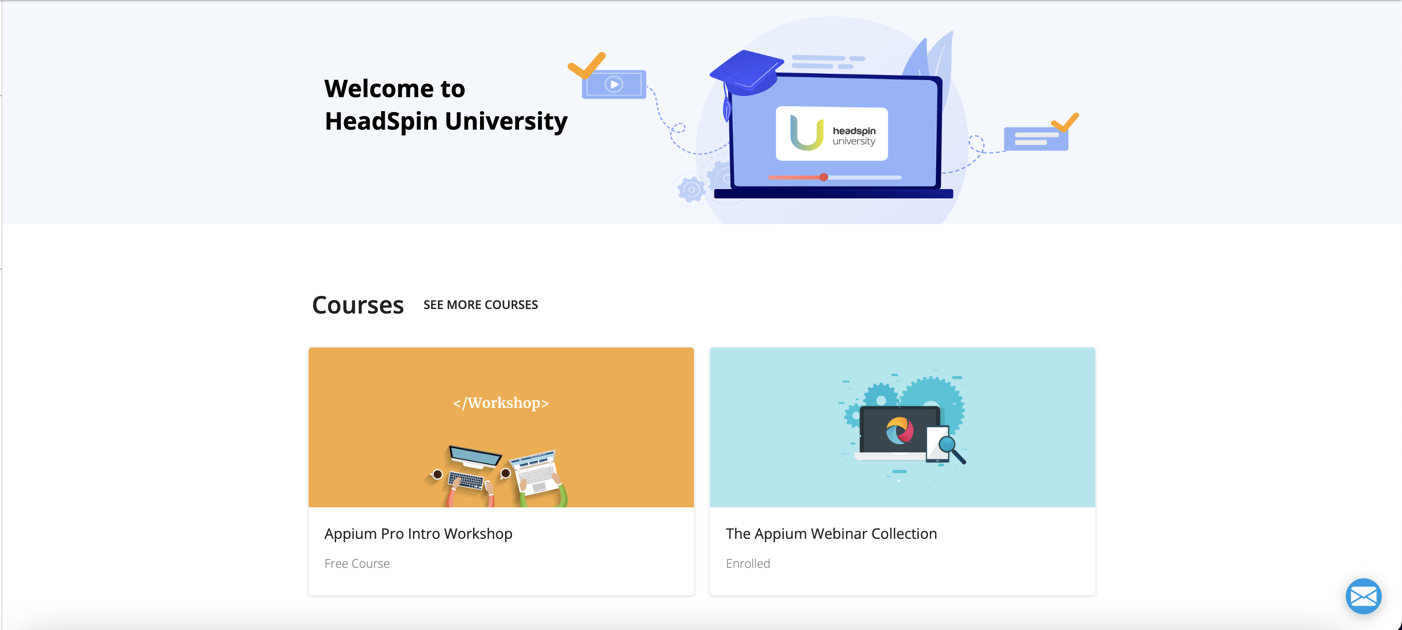
Created by Jonathan Lipps, Appium project lead and architect, HeadSpin University is our educational tool to provide additional context for and assistance with testing tools such as Appium and Selenium. Using these courses you can gain hands-on training in various topics, and upon completion of the courses you will be awarded with certification appropriate to the course.
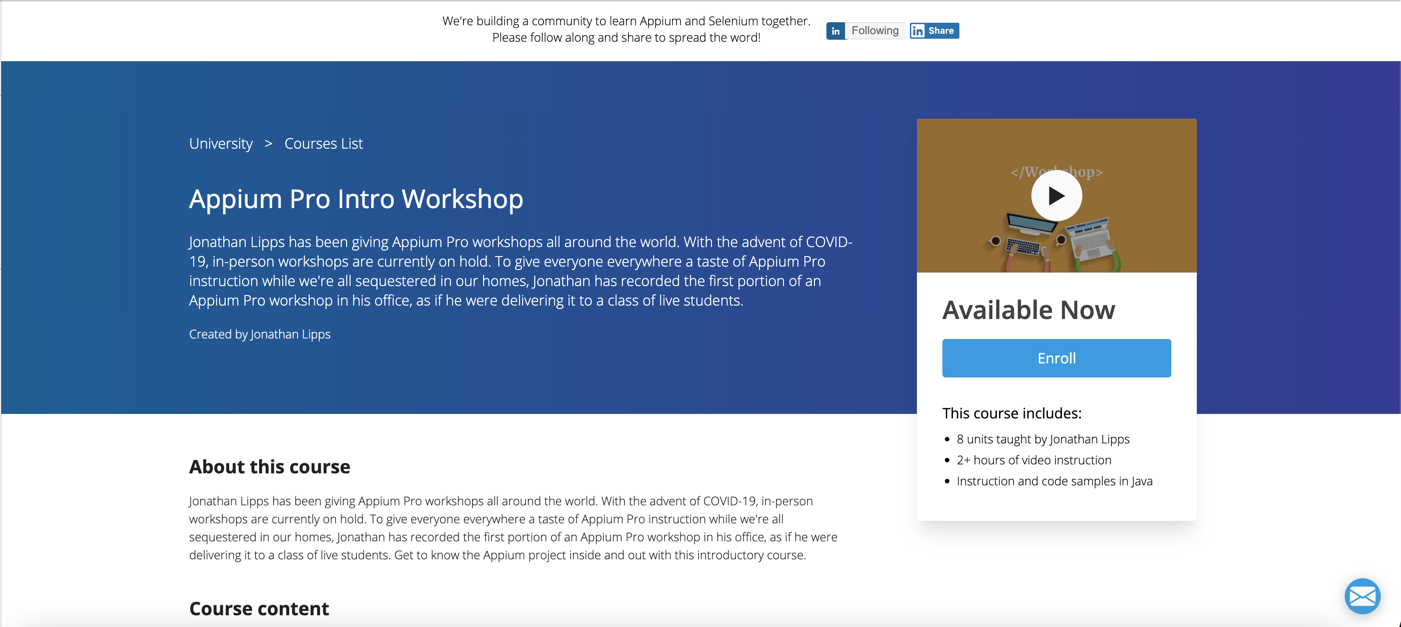
The University page displays a selection of courses on offer, as well as the news feed for the HeadSpin University program and a link at the bottom of the page to assist you with signing up/enrolling in HeadSpin University.
INFORMATIONAL PAGES
The icons at the bottom of the Nav Bar are for informational purposes.
Documentation
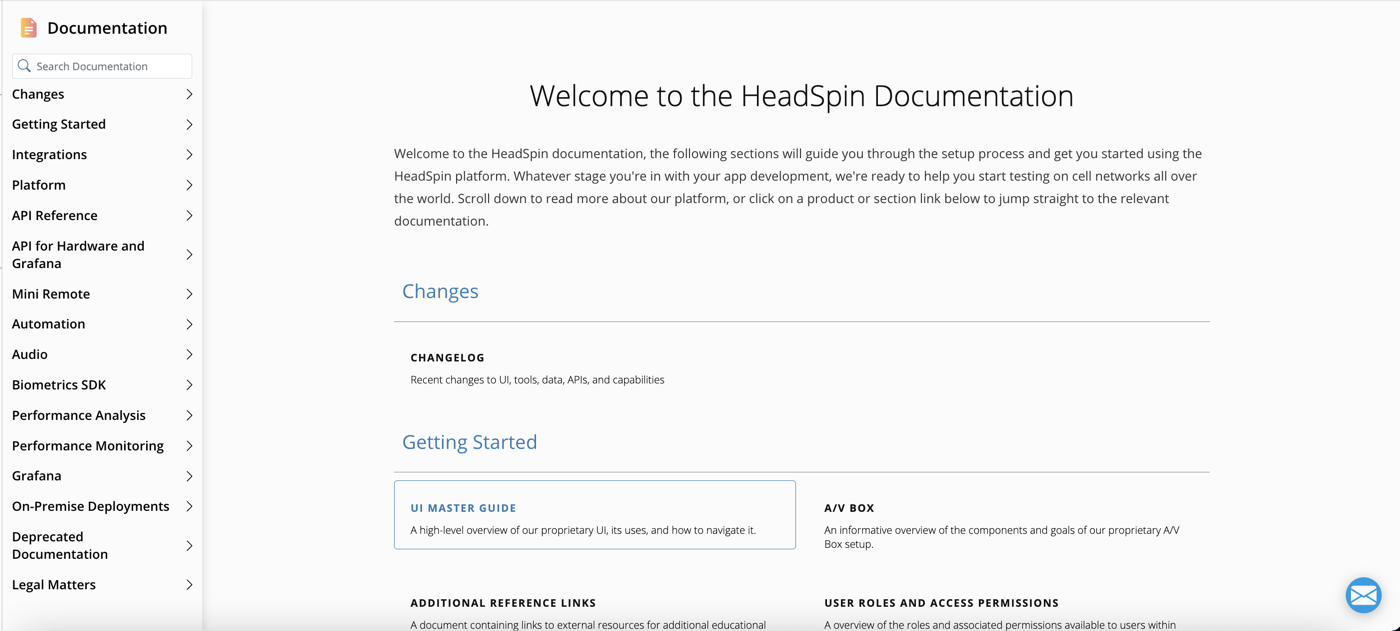
The Documentation icon will take you to our documentation page. Various documents regarding our platform, toolsets, automation assistance, license agreement and other helpful content can be found here. You can search for a document in the search bar, or search for likely matches by simply searching for a keyword or phrase.
Copyright

This icon does not technically launch a standalone page; instead, clicking this icon from any page in the HeadSpin space will display the HeadSpin copyright information at the bottom of the screen, as well as our Terms of Use and Privacy Policy.
This concludes the general overview of the HeadSpin platform. If you have any questions, please feel free to contact your HeadSpin administrators, or visit our Documentation page for more information.
