


Chrome DevTools
Chrome DevTools on HeadSpin platform
Chrome DevTools is a set of Web Developer tools built into the Google Chrome browser. Chromium-based browsers such as Microsoft Edge browser also have it. DevTools help you inspect Web pages with editing DOM elements and debugging JavaScript.
HeadSpin provides you a way to inspect Web pages on browsers running on Pboxes via the Chrome DevTools over the internet. The DevTools provide a remote debugging for local server feature. The HeadSpin platform allows you to connect to our browsers from your local Chrome DevTools clients via the feature over secured network.
Table of Contents
Overview
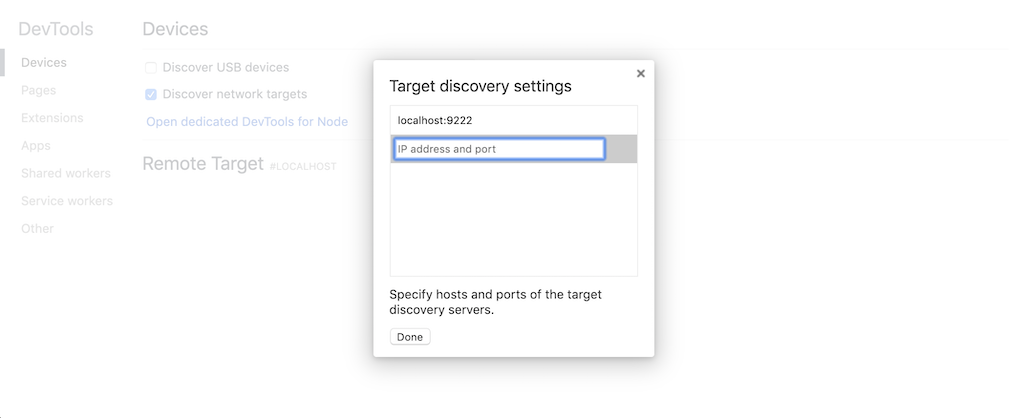
hs connect browser command launches a local server to establish a connection between Chrome Devtools running on your local machine and a browser running on a pbox. Once you launch the local server, you can register it as Remote Target via Discover network targets in chrome://inspect page on your browser. Then, you can see the list of available pages on the browser.
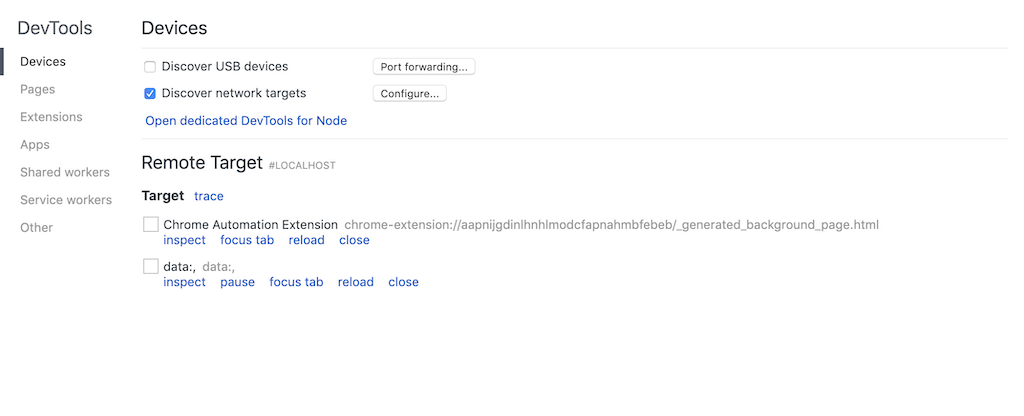
An inspect link opens a devtools window on your local machine to interact with the target page via the devtools window.
The <code class="dcode">hs connect browser</code> command allows you to attach a browser launched by a Selenium Automation script. If you have a browser session id, the command attaches to the session. Then, you can inspect the browser with DevTools. In the Python selenium binding, <code class="dcode">self.driver.session_id</code> returns the browser session id. <code class="dcode">hs browser sessions</code> command also prints available browser session ids on a pbox host.
Configuration
Connect to a new browser session on a pbox
Create a new browser session on a pbox and attach to the session.
- <code class="dcode">--api-token</code> is an API token to authorize the request
- The first argument is a device address. The format is <code class="dcode"><device_id>@<hostname>.
Then, once you register <code class="dcode">localhost:9222</code> on your browser via <code class="dcode">chrome://inspect</code>, the target page will appear. The session will close when you input <code class="dcode">^C</code> on the terminal or cancel the browser running on the pbox via HeadSpin Remote Control.
Attach to a browser session
Lets assume <code class="dcode">d43fa6fd-9f38-11ea-8fbe-38f9d365a6f1</code> is a browser session id you want to attach to.
The second argument is the session id. If specified, the command will attempt to attach to the associated session. Available pages will appear on <code class="dcode">chrome://inspect</code> shortly after the command succeeds.
Print available browser session ids
If your target host has available sessions which can be attached to, the below command will print their ids.
Customize the local server port
The <code class="dcode">hs connect browser</code> command can configure the local port with <code class="dcode">--local-port</code> flag. <code class="dcode">localhost:9222</code> is the default value. <code class="dcode">HTTPS_PROXY</code> environment variable allows you to send requests from the local server to our Pboxes over the proxy.
Please check the command or type <code class="dcode">hs connect</code> or <code class="dcode">hs browser</code> to see the help.
Chrome DevTools Lighthouse
Chrome DevTools provides a feature, Lighthouse, to visualize the quality of Web pages. The tool embedded in the Chrome DevTools tab does not work through the remote debugger, but you can collect the data from browsers running on our pboxes with the Node CLI. The lighthouse command on your local machine can attach to a DevTools session. The command provides a <code class="dcode">--port</code> option, so you can specify the local port of <code class="dcode">hs connect browser</code> for it. Please read the <code class="dcode">--help</code> option for more details.
Example
Let's create a browser session for devtools with <code class="dcode">hs connect browser</code> command on a terminal. The <code class="dcode">hs</code> command launches a local server with <code class="dcode">9222</code> port by default.
Then, <code class="dcode">lighthouse</code> command can communicate with the browser via the local port on another terminal.
If you want to disable push notification feature on the browser, you can set it with the below flag. Please check the <code class="dcode">--arguments</code> flag by <code class="dcode">--help</code> option.
Then, you can get a report under the browser configuration. Sometimes an error <code class="dcode">NO_FCP</code> appears in the lighthouse log as same as local execution. Then, please consider retrying the <code class="dcode">lighthouse</code> command again.
Automation libraries over Chrome DevTools
Chrome DevTools helps browser automation. Some libraries such as WebdriverIO DevTools Service, Puppeteer, Playwright and Taiko are typical libraries to use. They manage DevTools sessions differently, so this section shows you two ways to integrate our DevTools feature with them.
WebdriverIO
WebdriverIO establishes a selenium session in the beginning. Then, it establishes a DevTools session referencing the response of a new selenium session request.
<code class="dcode">hs connect</code> launches a proxy server on the local machine like <code class="dcode">hs connect browser</code>, but the <code class="dcode">hs connect</code> command handles all of HTTP/WebSocket requests to a pbox from your local machine.
Launch the proxy server on your local machine.
Then, please specify <code class="dcode">port: '9222'</code> in your WebDriverIO configuration file <code class="dcode">wdio.conf.js</code>. When you run a WebDriverIO script with the <code class="dcode">port</code>, it can call DevTools commands such as <code class="dcode">browser.cdp('Page', 'getResourceTree')</code> via the proxy server. Please set arbitrary capabilities such as <code class="dcode">headspin:capture</code> in the WebdriverIO's capability.
The proxy server handles only one session at a time. Once you finish a session, you can establish a new session via the same proxy server, but it cannot handle multiple sessions at the same time. Starting a new session will override an existing session.
Puppeteer
Puppeteer can connect to an existing browser process. <code class="dcode">hs connect browser</code> creates a browser session on a pbox, then <code class="dcode">puppeteer.connect(option)</code> attaches to the session with <code class="dcode">browserURL</code> option.
On a terminal, you can launch a browser session on a pbox.
The command prints a localhost URL like <code class="dcode">http://localhost:9222</code>. (The local port is customizable.) Then, <code class="dcode">puppeteer.connect</code> allows you to connect to the browser session via the localhost URL.
Below is an example JavaScript code to attach to an existing browser session.
<code class="dcode">browserWSEndpoint</code> option is also available instead of <code class="dcode">browserURL</code>. In this case, the endpoint must be like <code class="dcode">ws://localhost:9222/devtools/browser/fa1e7ced-c136-4379-a030-360f9f0eb6b4</code> by <code class="dcode">http://localhost:9222/json/version</code>. Please read the below Playwright section about this endpoint.
Please do not forget to exit the <code class="dcode">hs connect browser</code> command after test running to cleanup the browser session on the pbox.
<code class="dcode">hs connect browser</code> has options to launch a browser with arbitrary flags such as enabling HeadSpin capture. Please check <code class="dcode">--help</code> option for more details.
Note: Puppeteer handles browsers with low level DevTools protocol, so for a page to be captured it must be the focused page. The above <code class="dcode">browser.targets()[0].page()</code> returns the default active page titled <code class="dcode">data</code>;.
Playwright
Playwright is a library to achieve browser automation with a single API. It can also connect to an existing session like Puppeteer to a browser running on our Pboxes.
The project requires newer browser versions or sometimes it expects in development binaries. For example, Playwright supports WebKit, but it is not the same Safari browser that runs on macOS. The version of WebKit used by Playwright has customizations designed to make it work with Playwright. Firefox also requires a patched version built for Playwright. It is not the official, published version of Firefox.
This means that Playwright cannot run against the stable releases of the Firefox and Safari browsers. HeadSpin Pboxes currently do not support such customized Firefox and WebKit browsers.
Hence, please make sure the browser versions on Pboxes are the expected ones for you. If you want newer ones, let us know.
Same as Puppeteer, Playwright also expects <code class="dcode">hs connect browser</code> command is already running on your local machine. Let's assume the local port by the <code class="dcode">hs connect browser</code> command is <code class="dcode">9222</code>.
Then, <code class="dcode">http://localhost:9222/json/version</code> returns a JSON about the current running browser. <code class="dcode">webSocketDebuggerUrl</code> key has a WebSocket URL such as <code class="dcode">ws://localhost:9222/devtools/browser/fa1e7ced-c136-4379-a030-360f9f0eb6b4</code>. The URL is the <code class="dcode">wsEndpoint</code> you should specify as an argument for Playwright.
Below is an example script.
Once you run the script on your local machine, the <code class="dcode">example.png</code> file is created on the same directory.
Note: Playwright handles browsers with low level DevTools protocol, same as Puppeteer above.
Tips
Run multiple DevTools sessions in parallel
<code class="dcode">hs connect browser</code> and <code class="dcode">hs connect</code> occupy a local port to handle Chrome DevTools properly. If you want to run tests in parallel, please launch multiple local servers with different local ports.
For example, you want to run a WebdriverIO script against two different browsers in parallel. Then, 1) launch a local server with 9222 local port and 2) launch a local server with 9223 local port. Then you can run the test script with <code class="dcode">baseUrl: 'http://localhost:9222'</code> and <code class="dcode">baseUrl: 'http://localhost:9223'</code> in parallel on your local.
- Local port 9222 <code class="dcode">$ hs connect --api-token <your_api_token> --local-port 9222 microsoftedge_80.0.361.62@test-pbox-host.headspin.io</code>
- Local port 9223 <code class="dcode">$ hs connect --api-token <your_api_token> --local-port 9223 chrome_78.0.3904.108@test-pbox-host.headspin.io</code>
Relax request timeout
<code class="dcode">hs connect</code> and <code class="dcode">hs connect browser</code> commands for browsers have a default request timeout of 30 seconds from the local server to a pbox. --timeout option can be used to change the timeout.
Waiting for session to be ready
When DevTools protocol is available via <code class="dcode">hs connect browser</code> command, <code class="dcode">curl -X GET http://localhost:9222/json</code> will return a JSON response with 200 HTTP status code like so:
<code class="dcode">webSocketDebuggerUrl</code> is <code class="dcode">wsEndpoint</code> in Puppeteer or Playwright. You can use this request to detect when the browser is ready for DevTools clients like Puppeteer to run their scenario.
